a3a110fe5adfe46bf91dcd4b3db4d85d5b3ac6b6
Overview
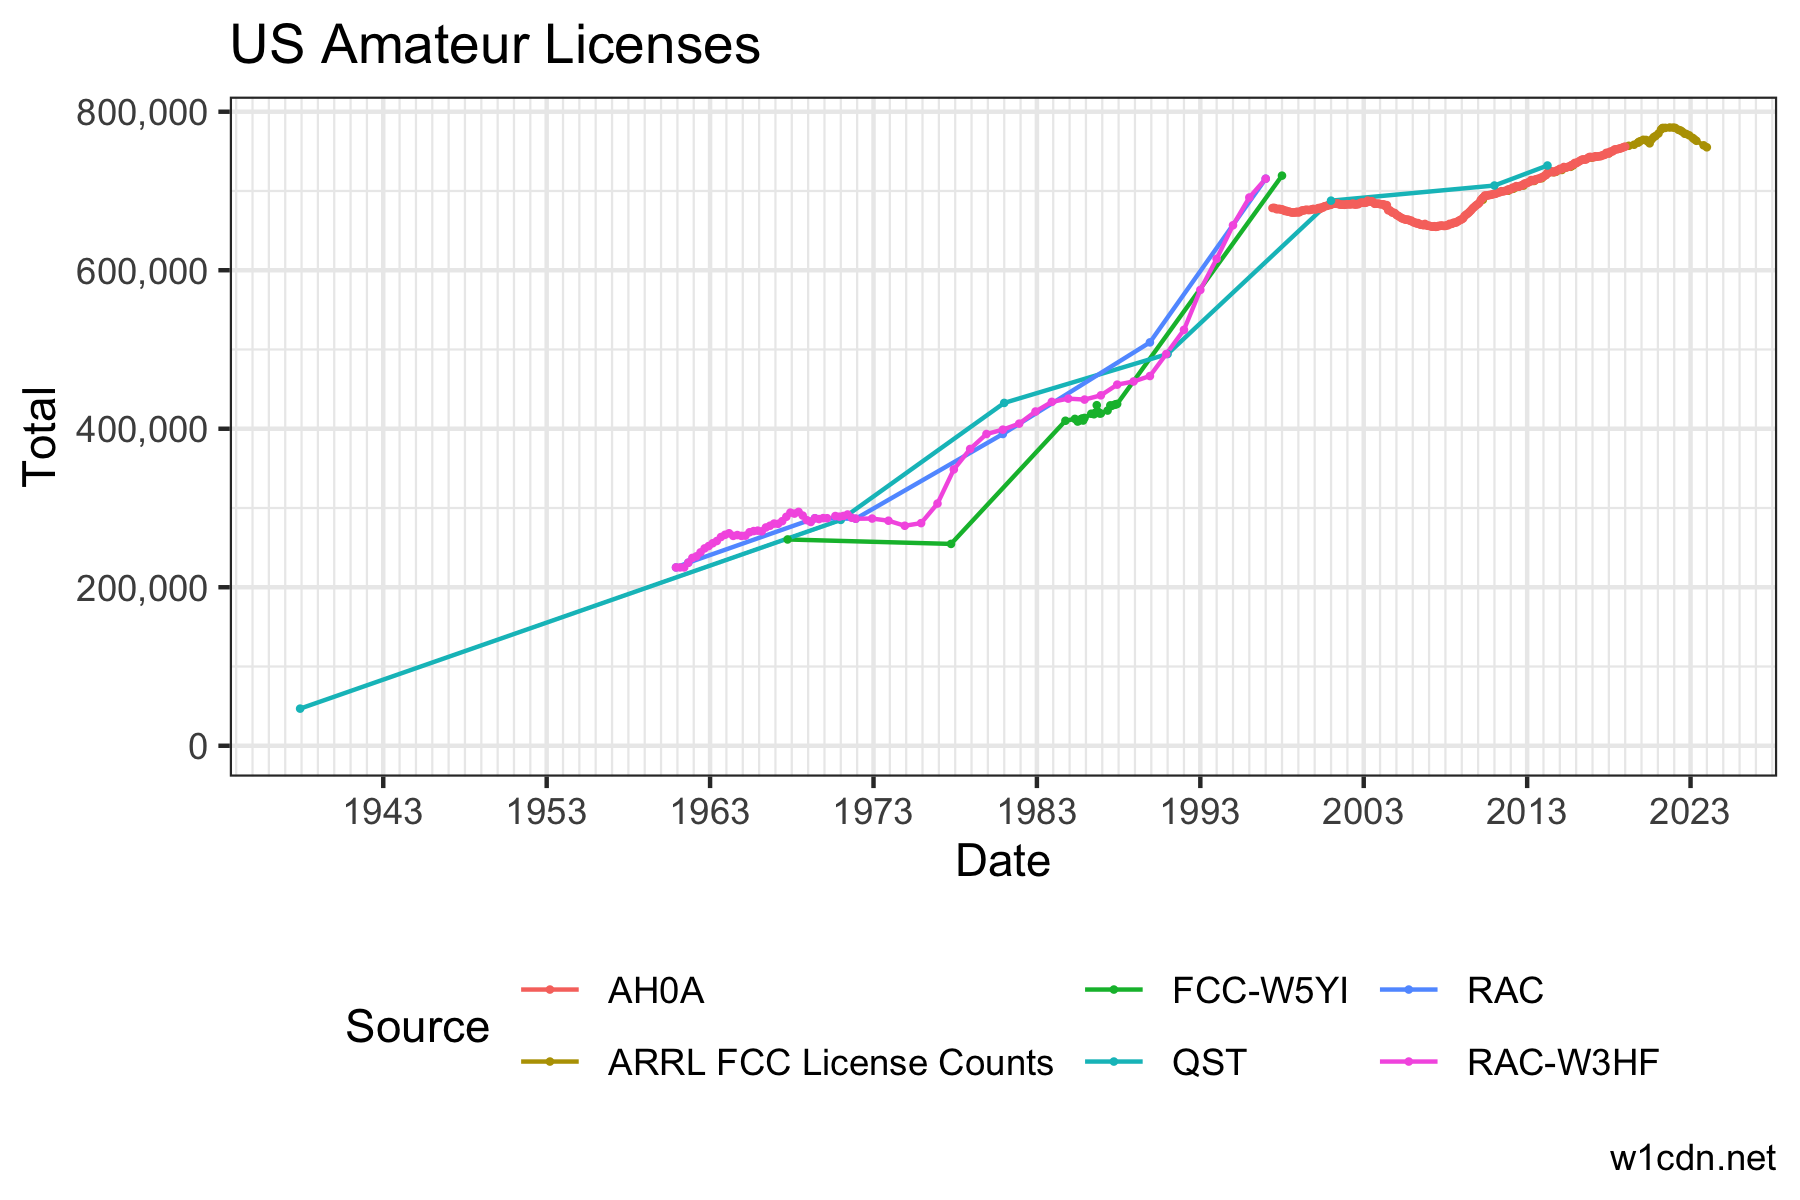
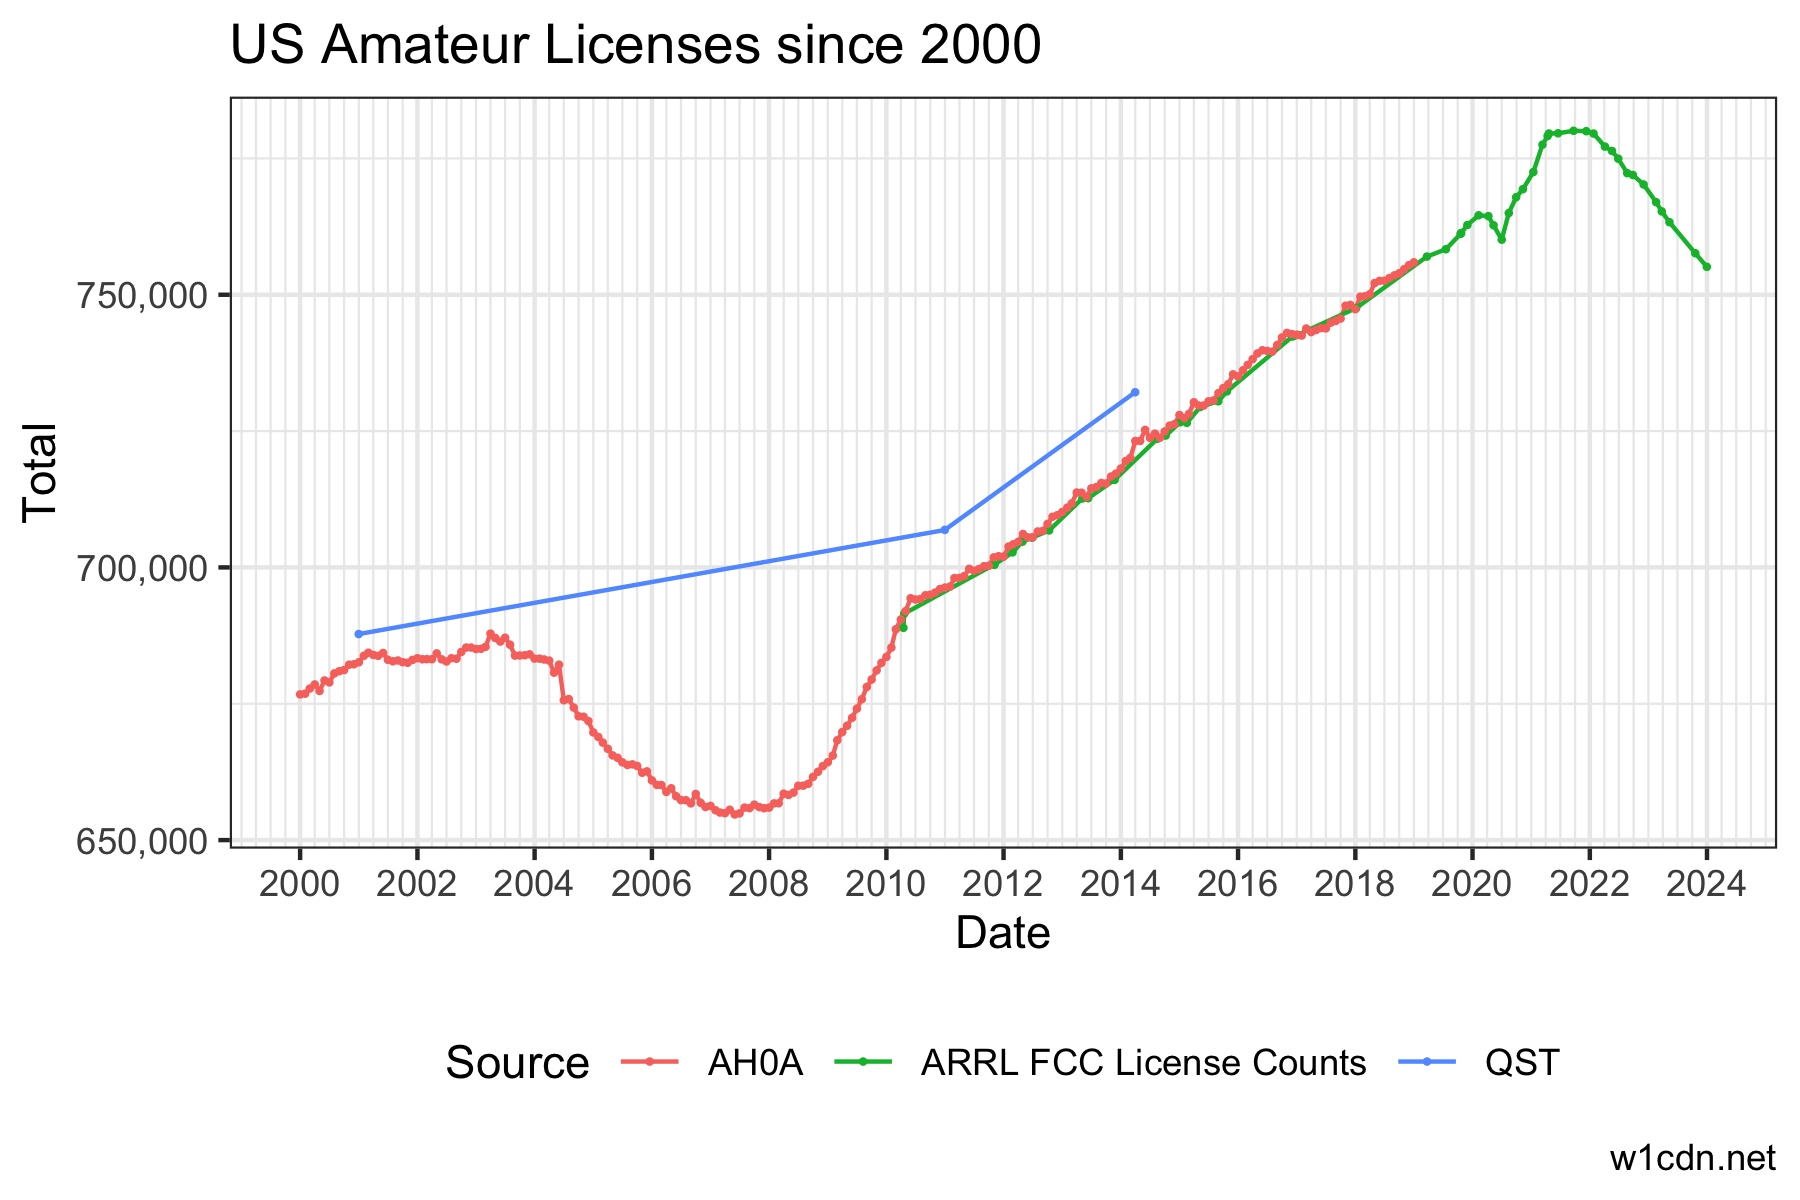
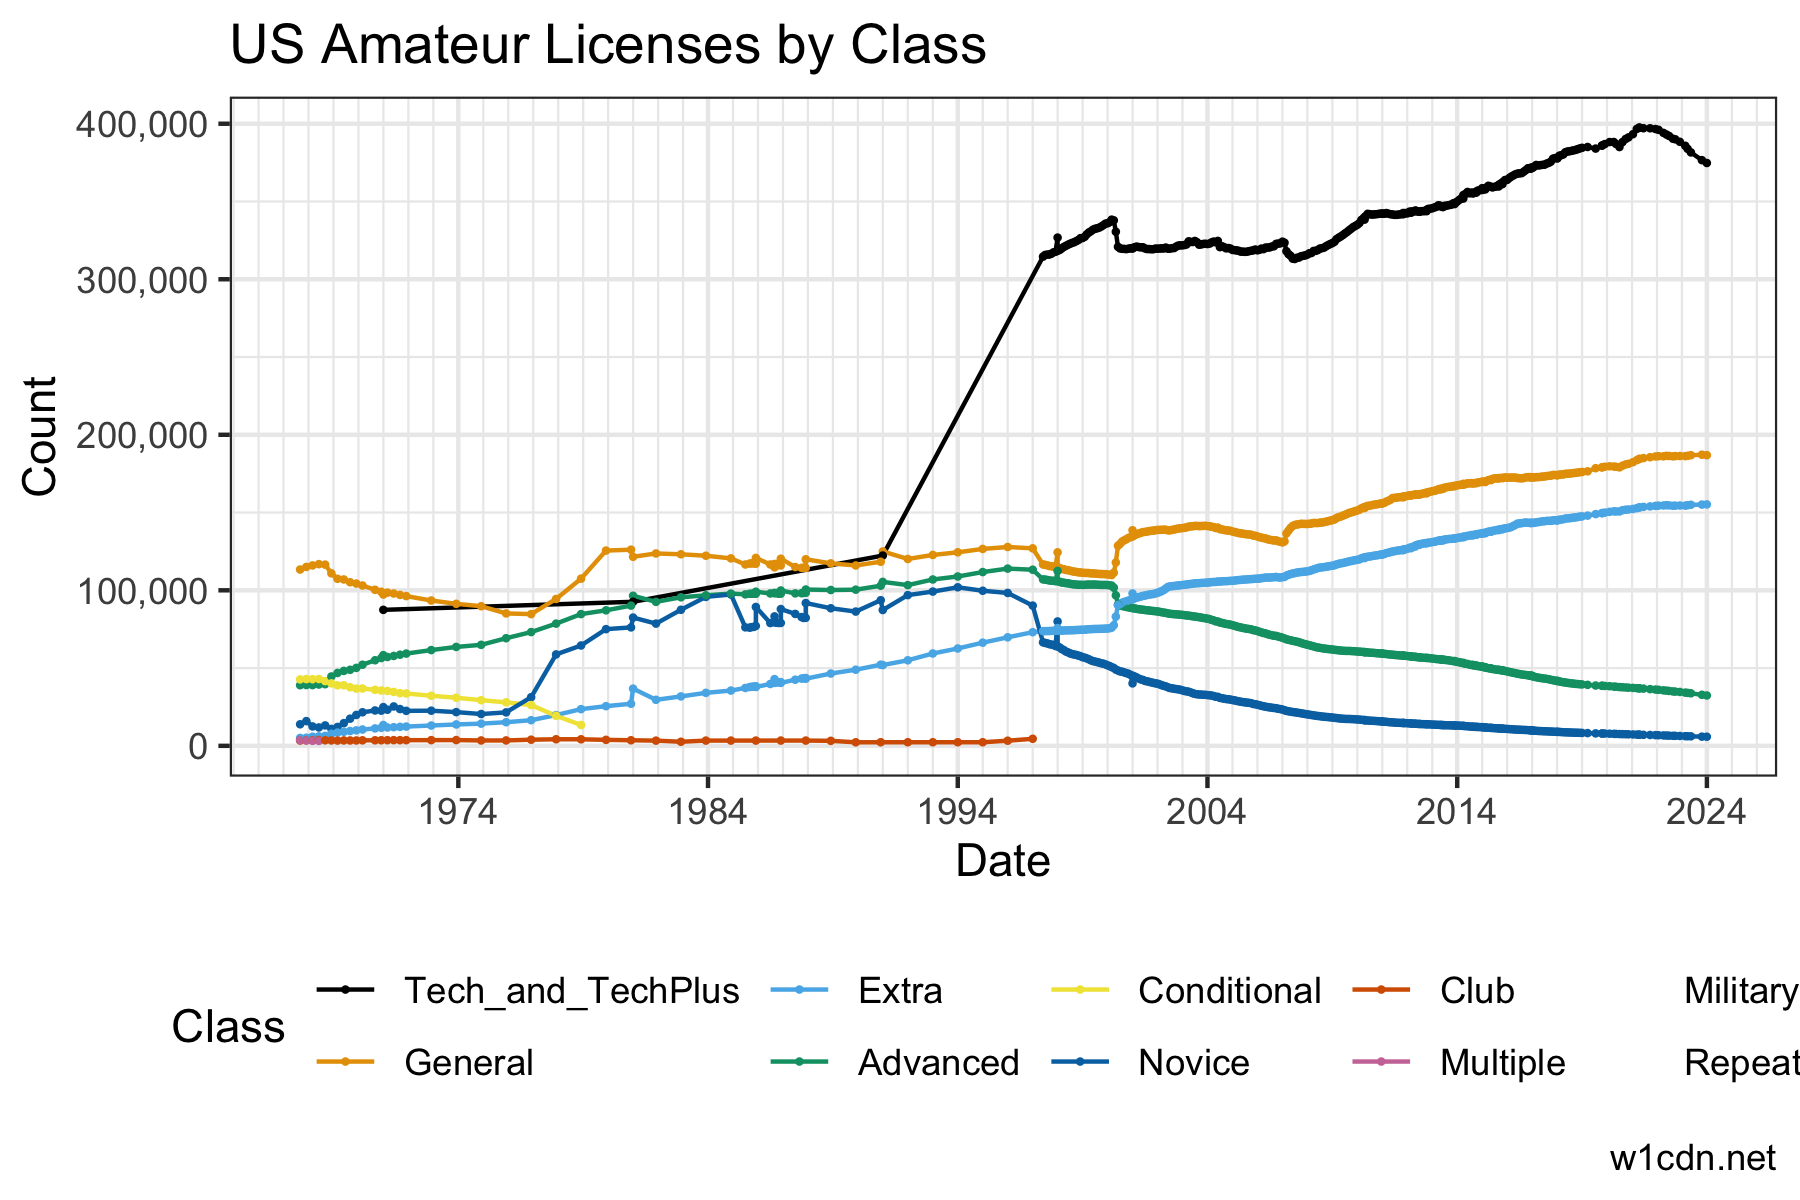
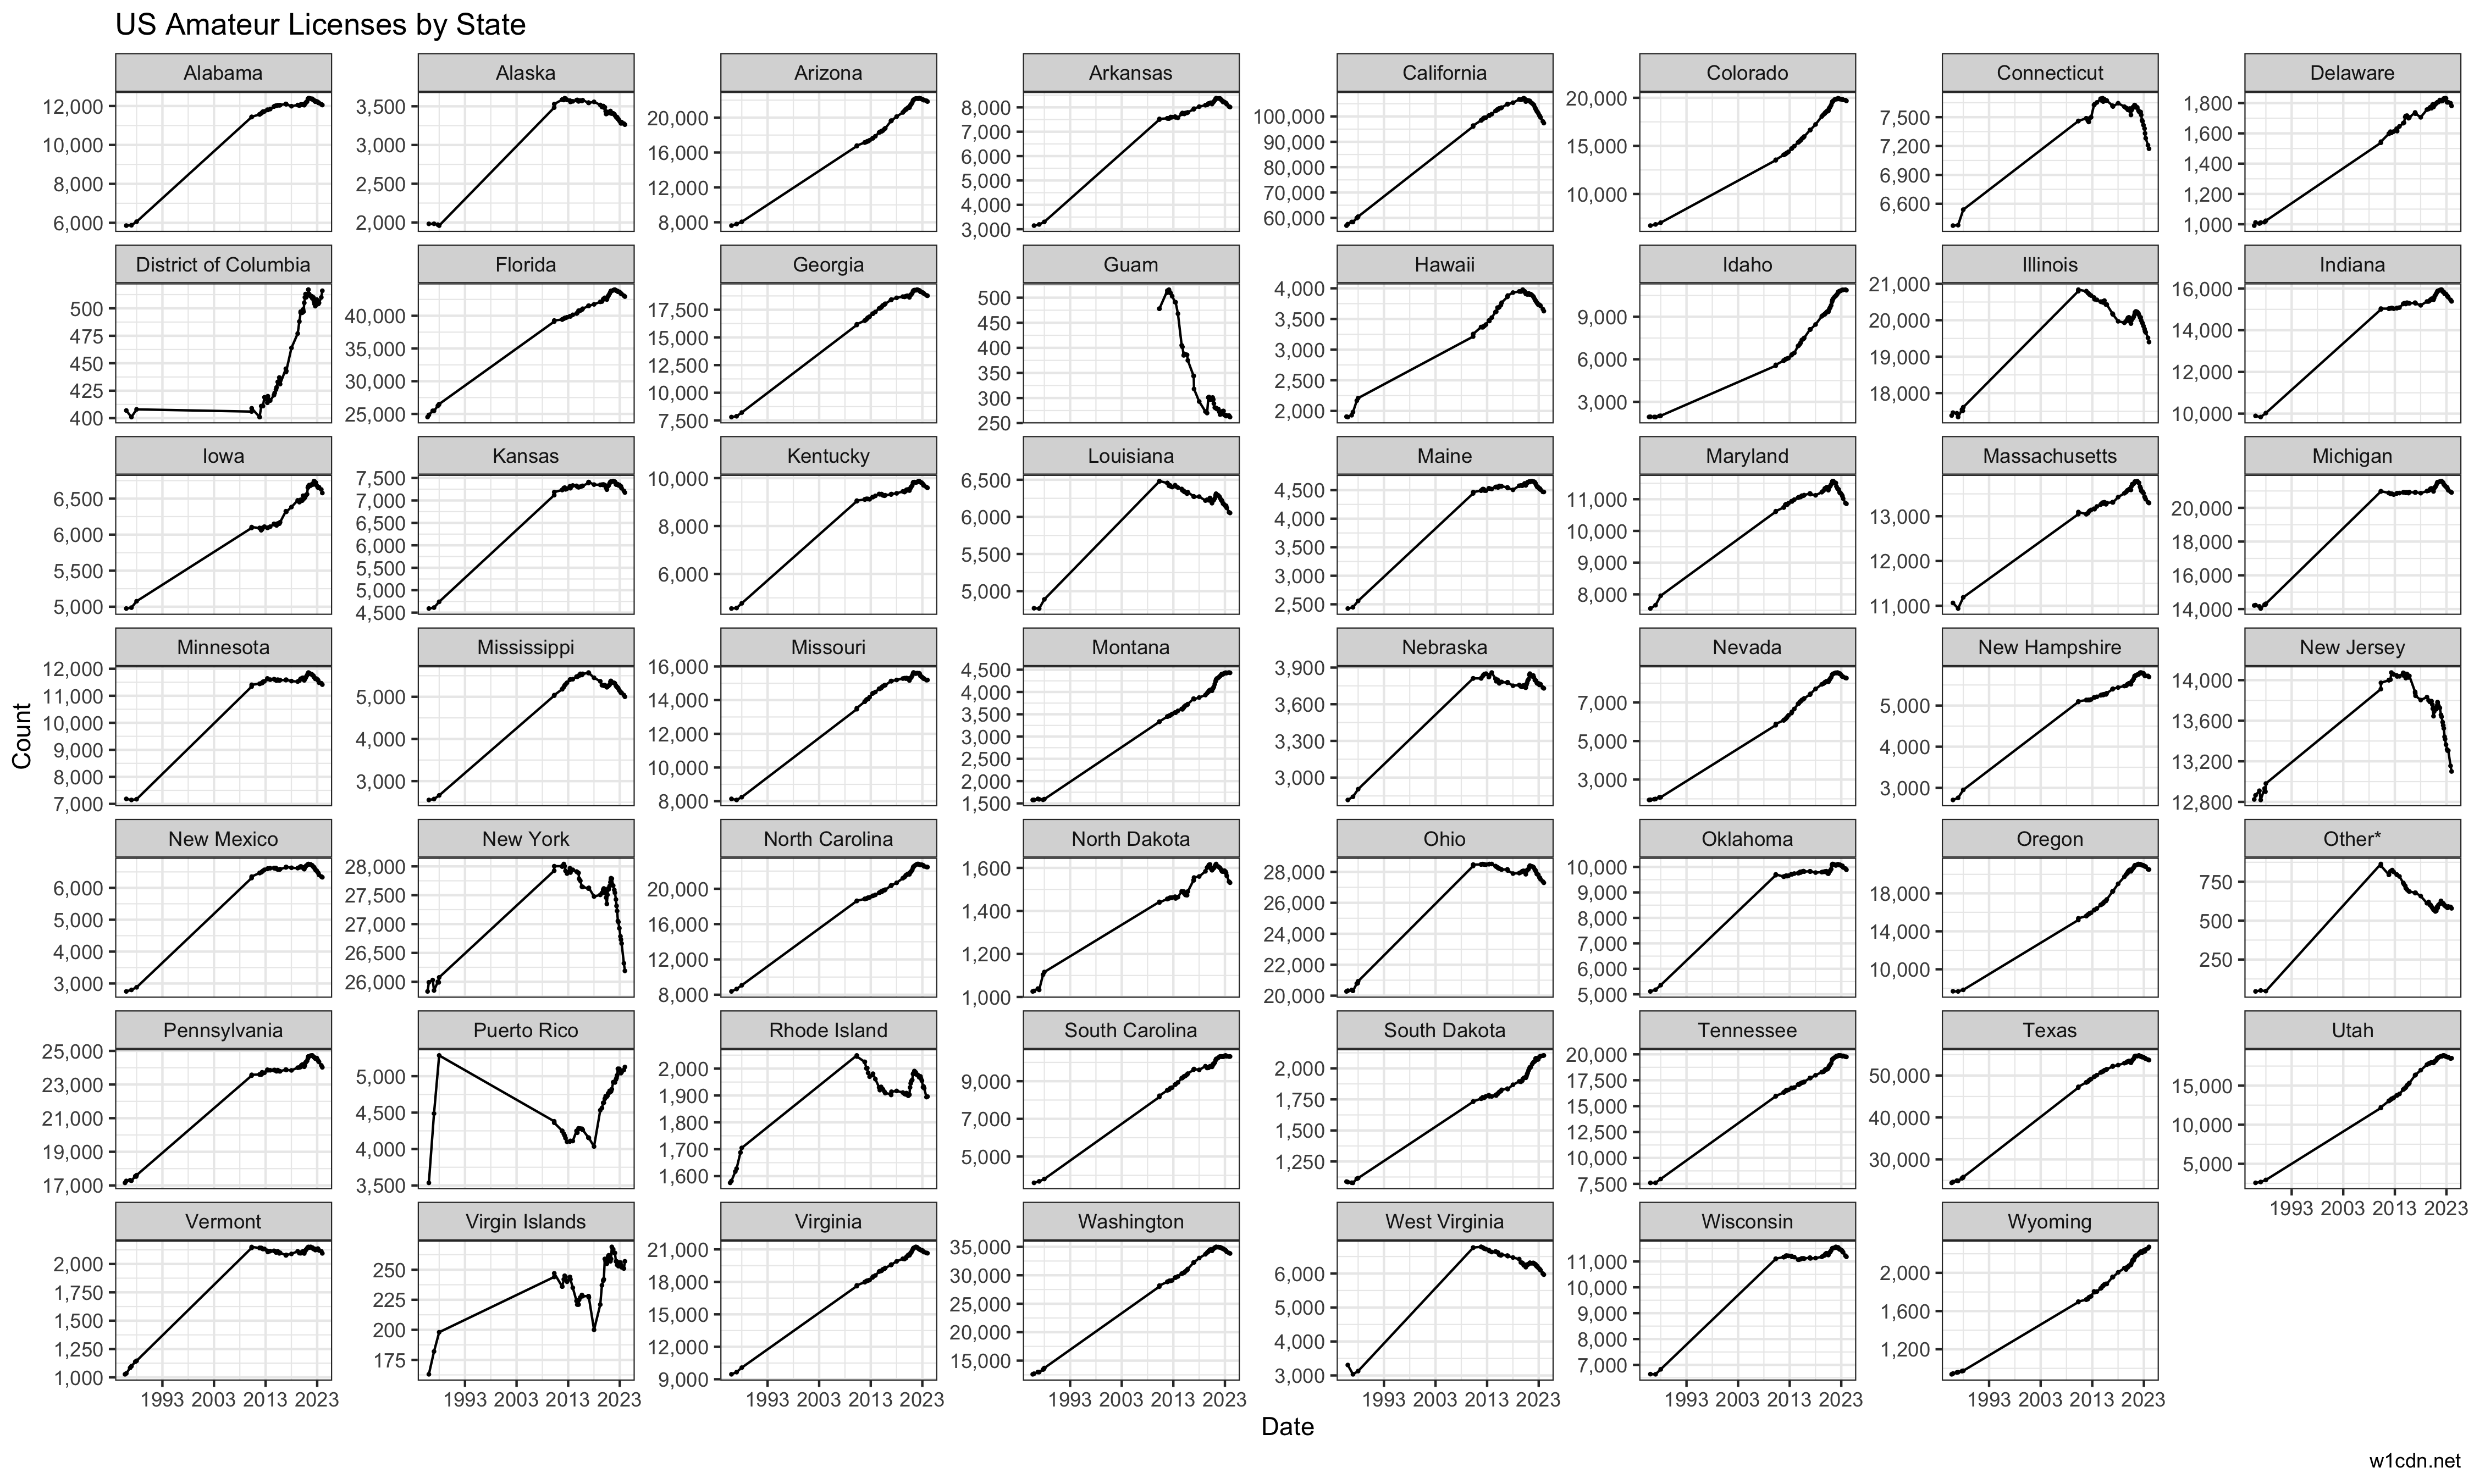
Data and code for analysis at https://mastodon.radio/@W1CDN/111723969200676208.
I'll get a blog post up at https://w1cdn.net at some point.
This is a work in progress. It is not intended to be immediately useful for detailed analysis, but to act as a guide for further investigation. As we figure out how to slice up and caveat data, it will get more organized.
Resources (not all integrated yet)
- Various items in the issue queue
- Post from KE9V that started this: https://mastodon.sdf.org/@jdavis/111720350879036543
- Blog post: https://ke9v.net/2024/01/08/fading-away.html
- ARRL stats on the Internet Wayback Machine: https://web.archive.org/web/20150905095114/http://www.arrl.org/fcc-license-counts
- AH0A data from FCC
- Total stats: http://ah0a.org/FCC/Licenses.html
- Main page: http://ah0a.org/FCC/index.html
- FCC numbers as images of tables: https://sites.google.com/site/amateurradiodata/home
- K8VSY's per capita estimates: https://k8vsy.radio/2021/09/ham-radio-licenses-us-states-per-capita.html
Rough Plots
Description
Languages
R
100%


