Overview
Data and code for analysis at https://mastodon.radio/@W1CDN/111723969200676208.
Introductory blog post: https://w1cdn.net/2024/01/us-ham-radio-license-counts-over-time/
This is a work in progress. It is not intended to be immediately useful for detailed analysis, but to act as a guide for further investigation. As we figure out how to slice up and caveat data, it will get more organized.
There may be errors! If something looks amiss, question it!
Resources (not all integrated yet)
- Various items in the issue queue
- ARRL FCC counts: https://web.archive.org/web/20150905095114/
- Added to Internet Wayback Machine daily: https://web.archive.org/web/20150905095114/http://www.arrl.org/fcc-license-counts
- Scraped daily, periodically added to dataset
- W5YI Report FCC counts: https://archive.org/details/w5yi_report?sort=date
- Screenshots to issue queue, then entered manually
- HamCall.net counts: https://hamcall.net/hamcallcounts.html
- Added to Internet Wayback Machine daily: https://web.archive.org/web/20240000000000*/%20https://hamcall.net/hamcallcounts.html
- Scraped daily, periodically added to dataset
- AE7Q counts: https://www.ae7q.com/query/stat/LicenseUSA.php
- Added to Internet Wayback Machine daily: https://web.archive.org/web/20240000000000*/https://www.ae7q.com/query/stat/LicenseUSA.php
- AH0A data from FCC
- Total stats: http://ah0a.org/FCC/Licenses.html (Wayback Machine)
- Main page: http://ah0a.org/FCC/index.html (Wayback Machine)
- FCC numbers as images of tables: https://sites.google.com/site/amateurradiodata/home
- K8VSY's per capita estimates: https://k8vsy.radio/2021/09/ham-radio-licenses-us-states-per-capita.html
- Post from KE9V that started this: https://mastodon.sdf.org/@jdavis/111720350879036543
- Blog post: https://ke9v.net/2024/01/08/fading-away.html
Contributing
I am trying to stage new data in the issues list, then copy that data into tabular format at a later date.
If you want to help, here are some ways:
- look at the issues and copy data into tabular format, share back in CSV format or pull request
- find new sources and create an issue for each new chunk of data (use best judgement)
- download data and QC: look for potential errors and inconsistencies, share those in a new issue
- download data and run analyses: share your interpretations
- choose your own way to contribute!
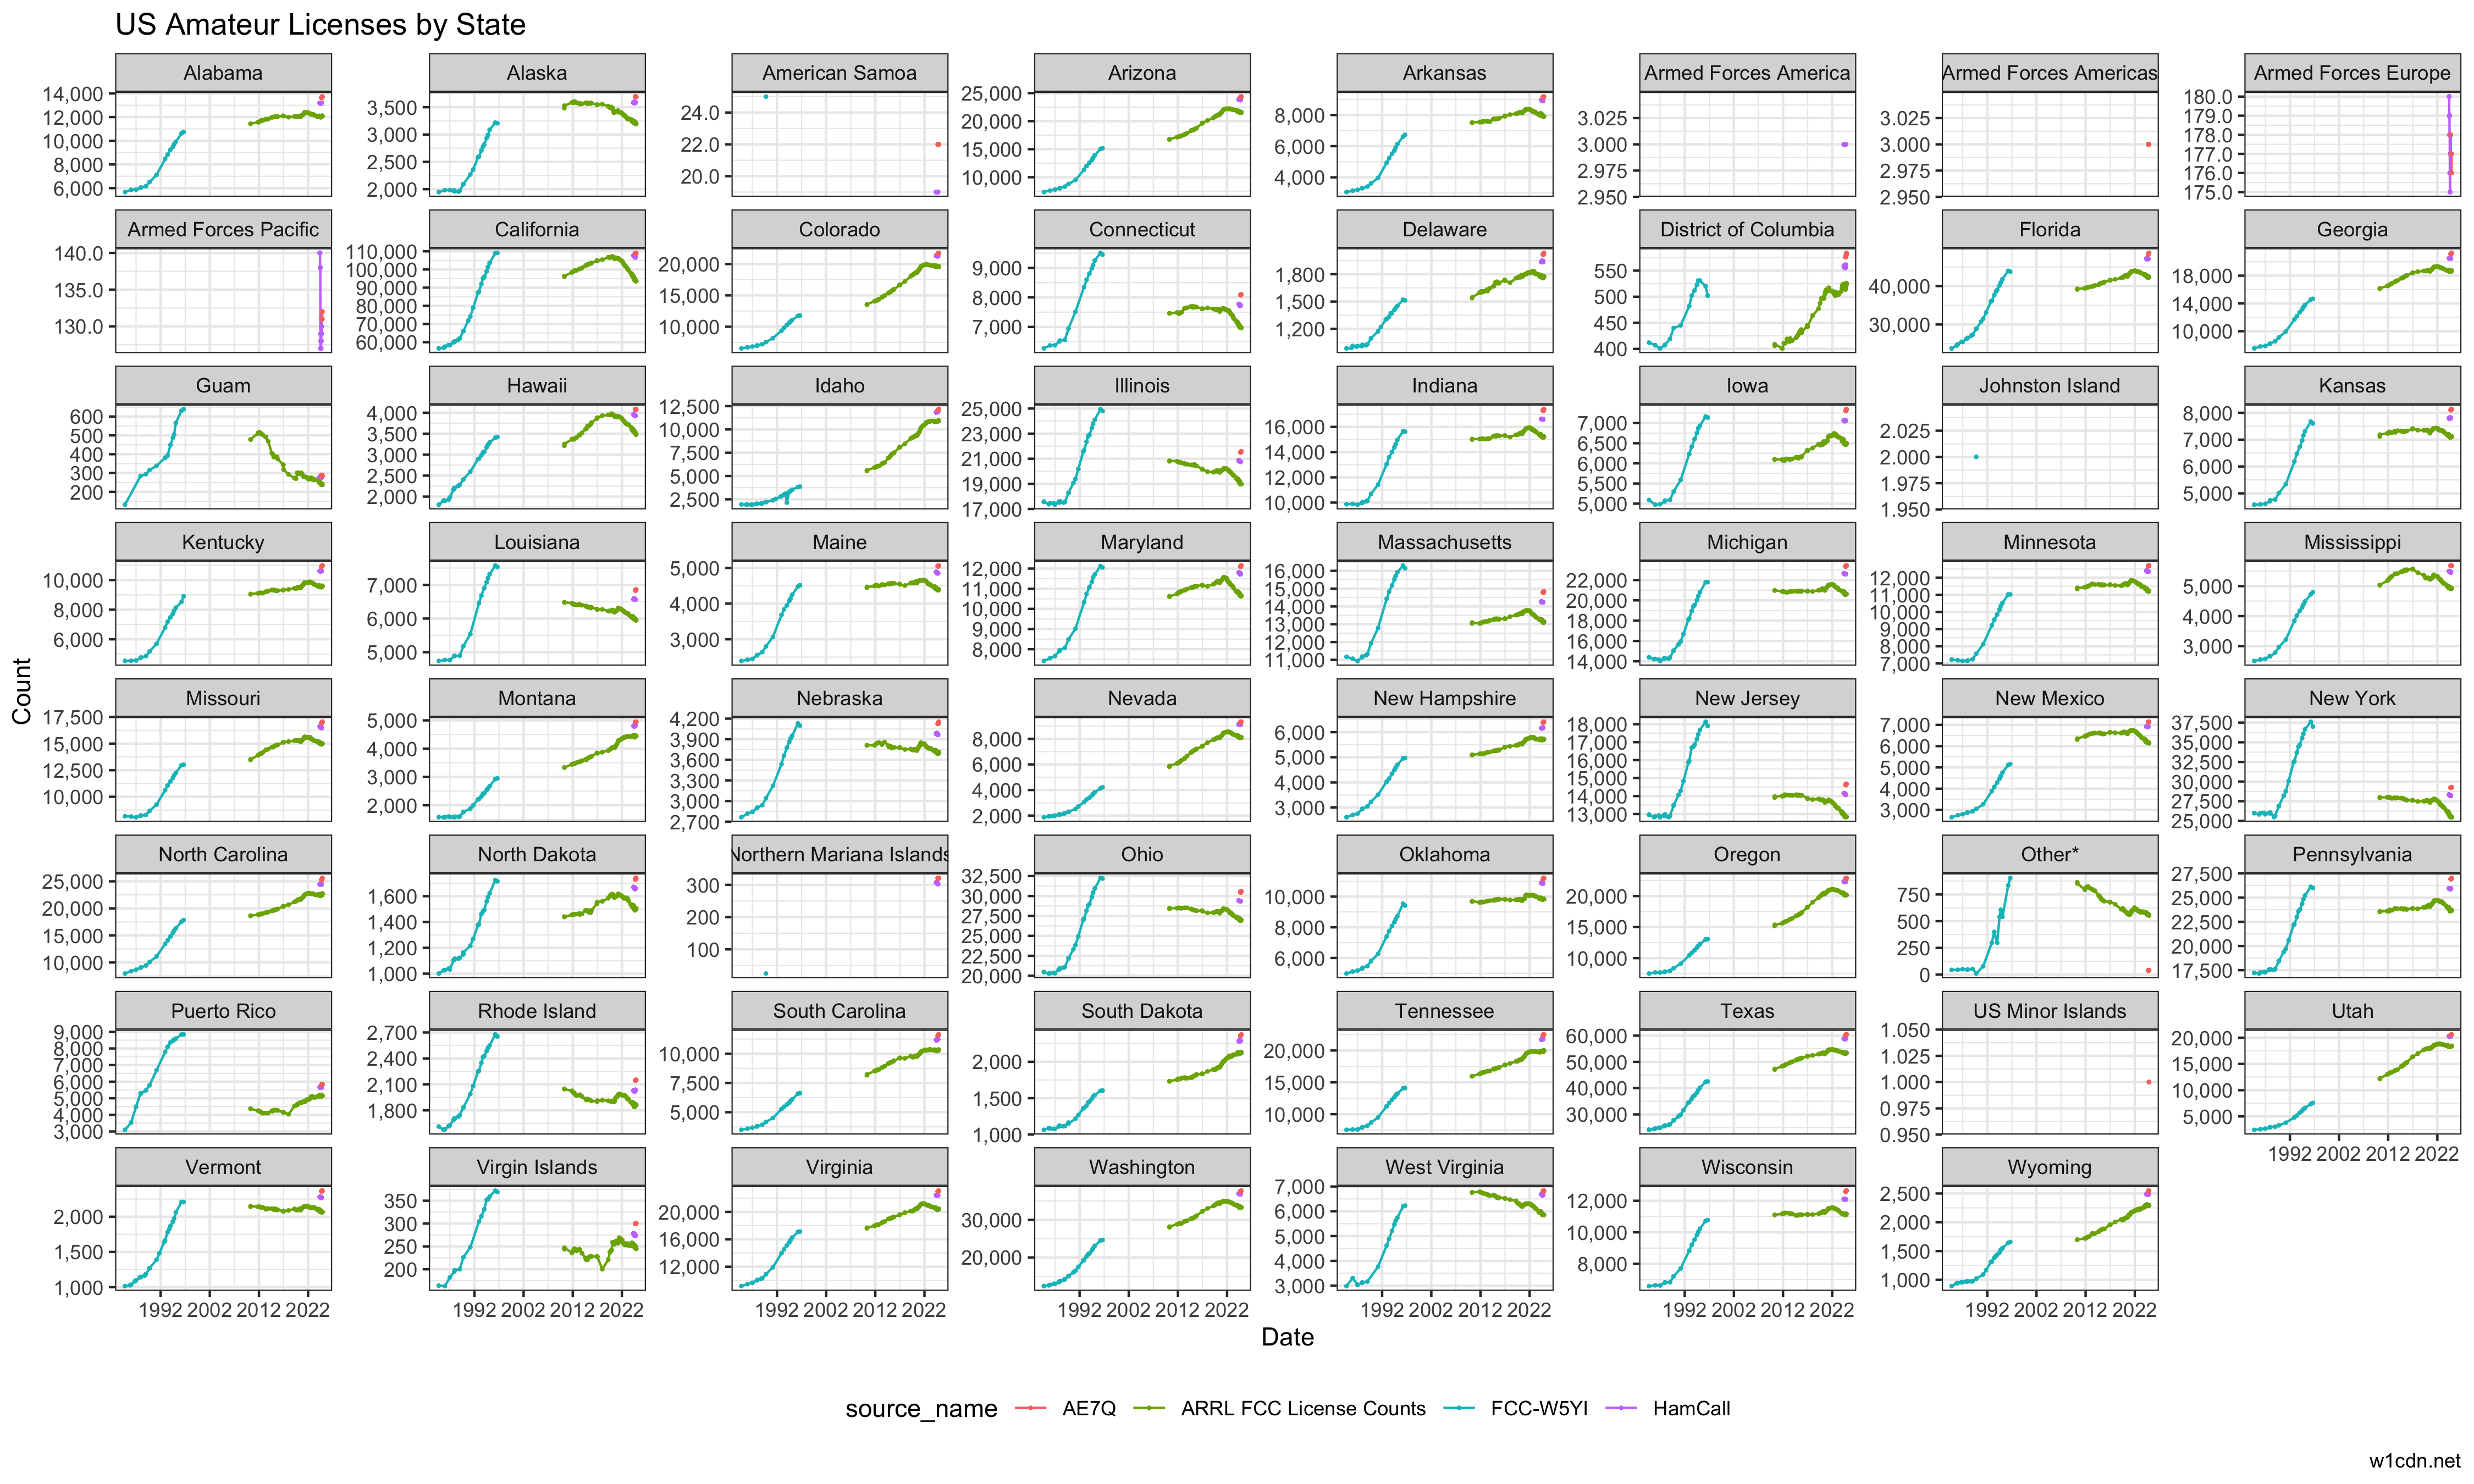
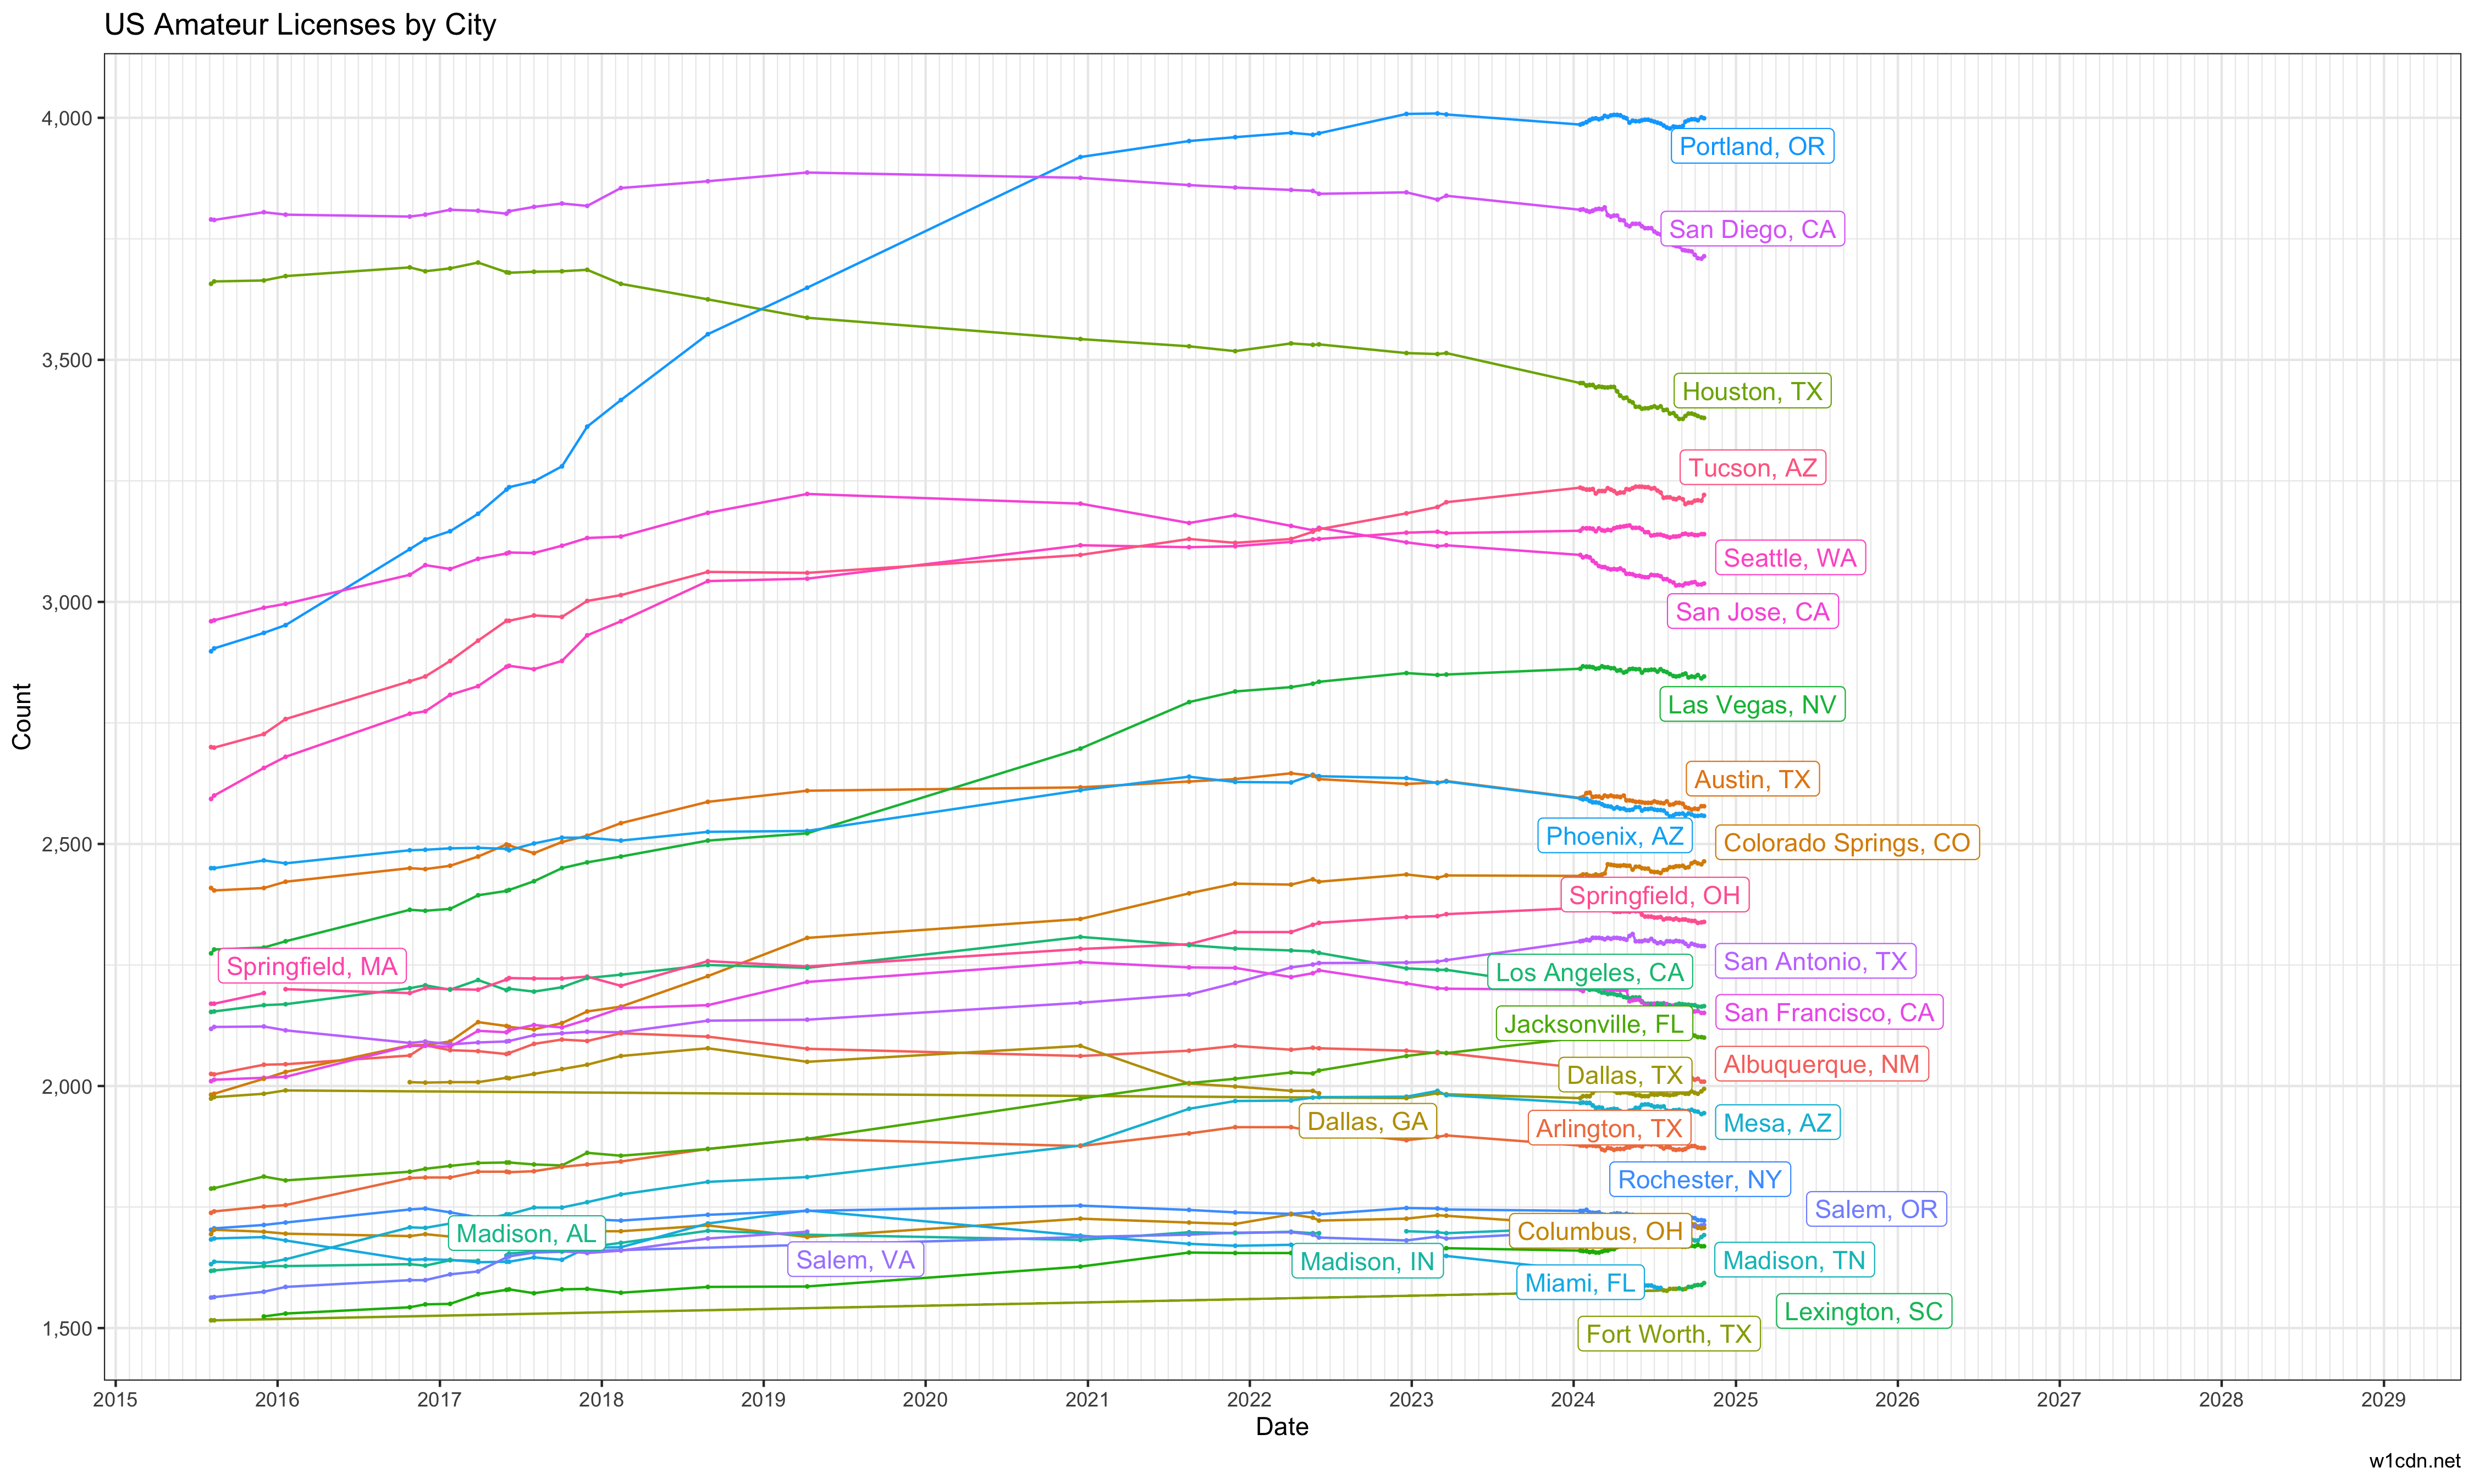
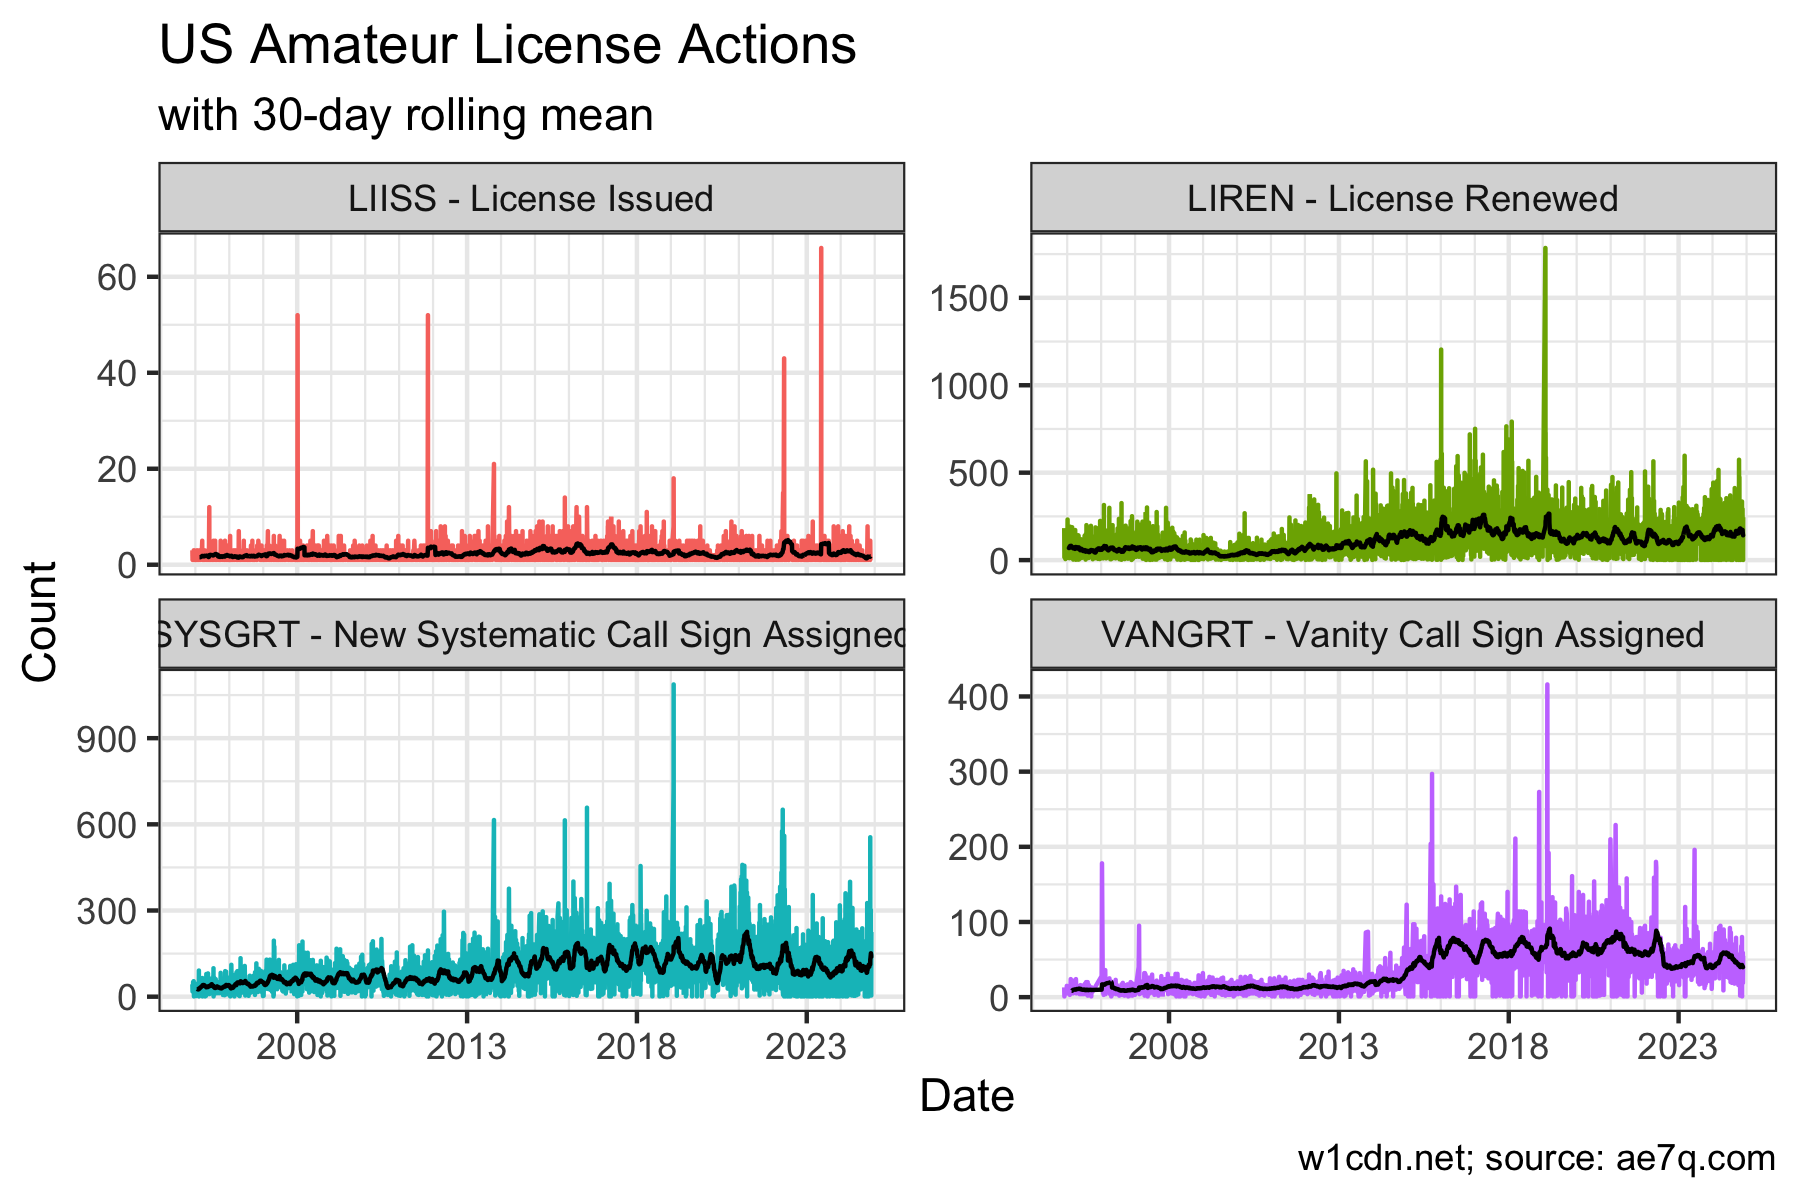
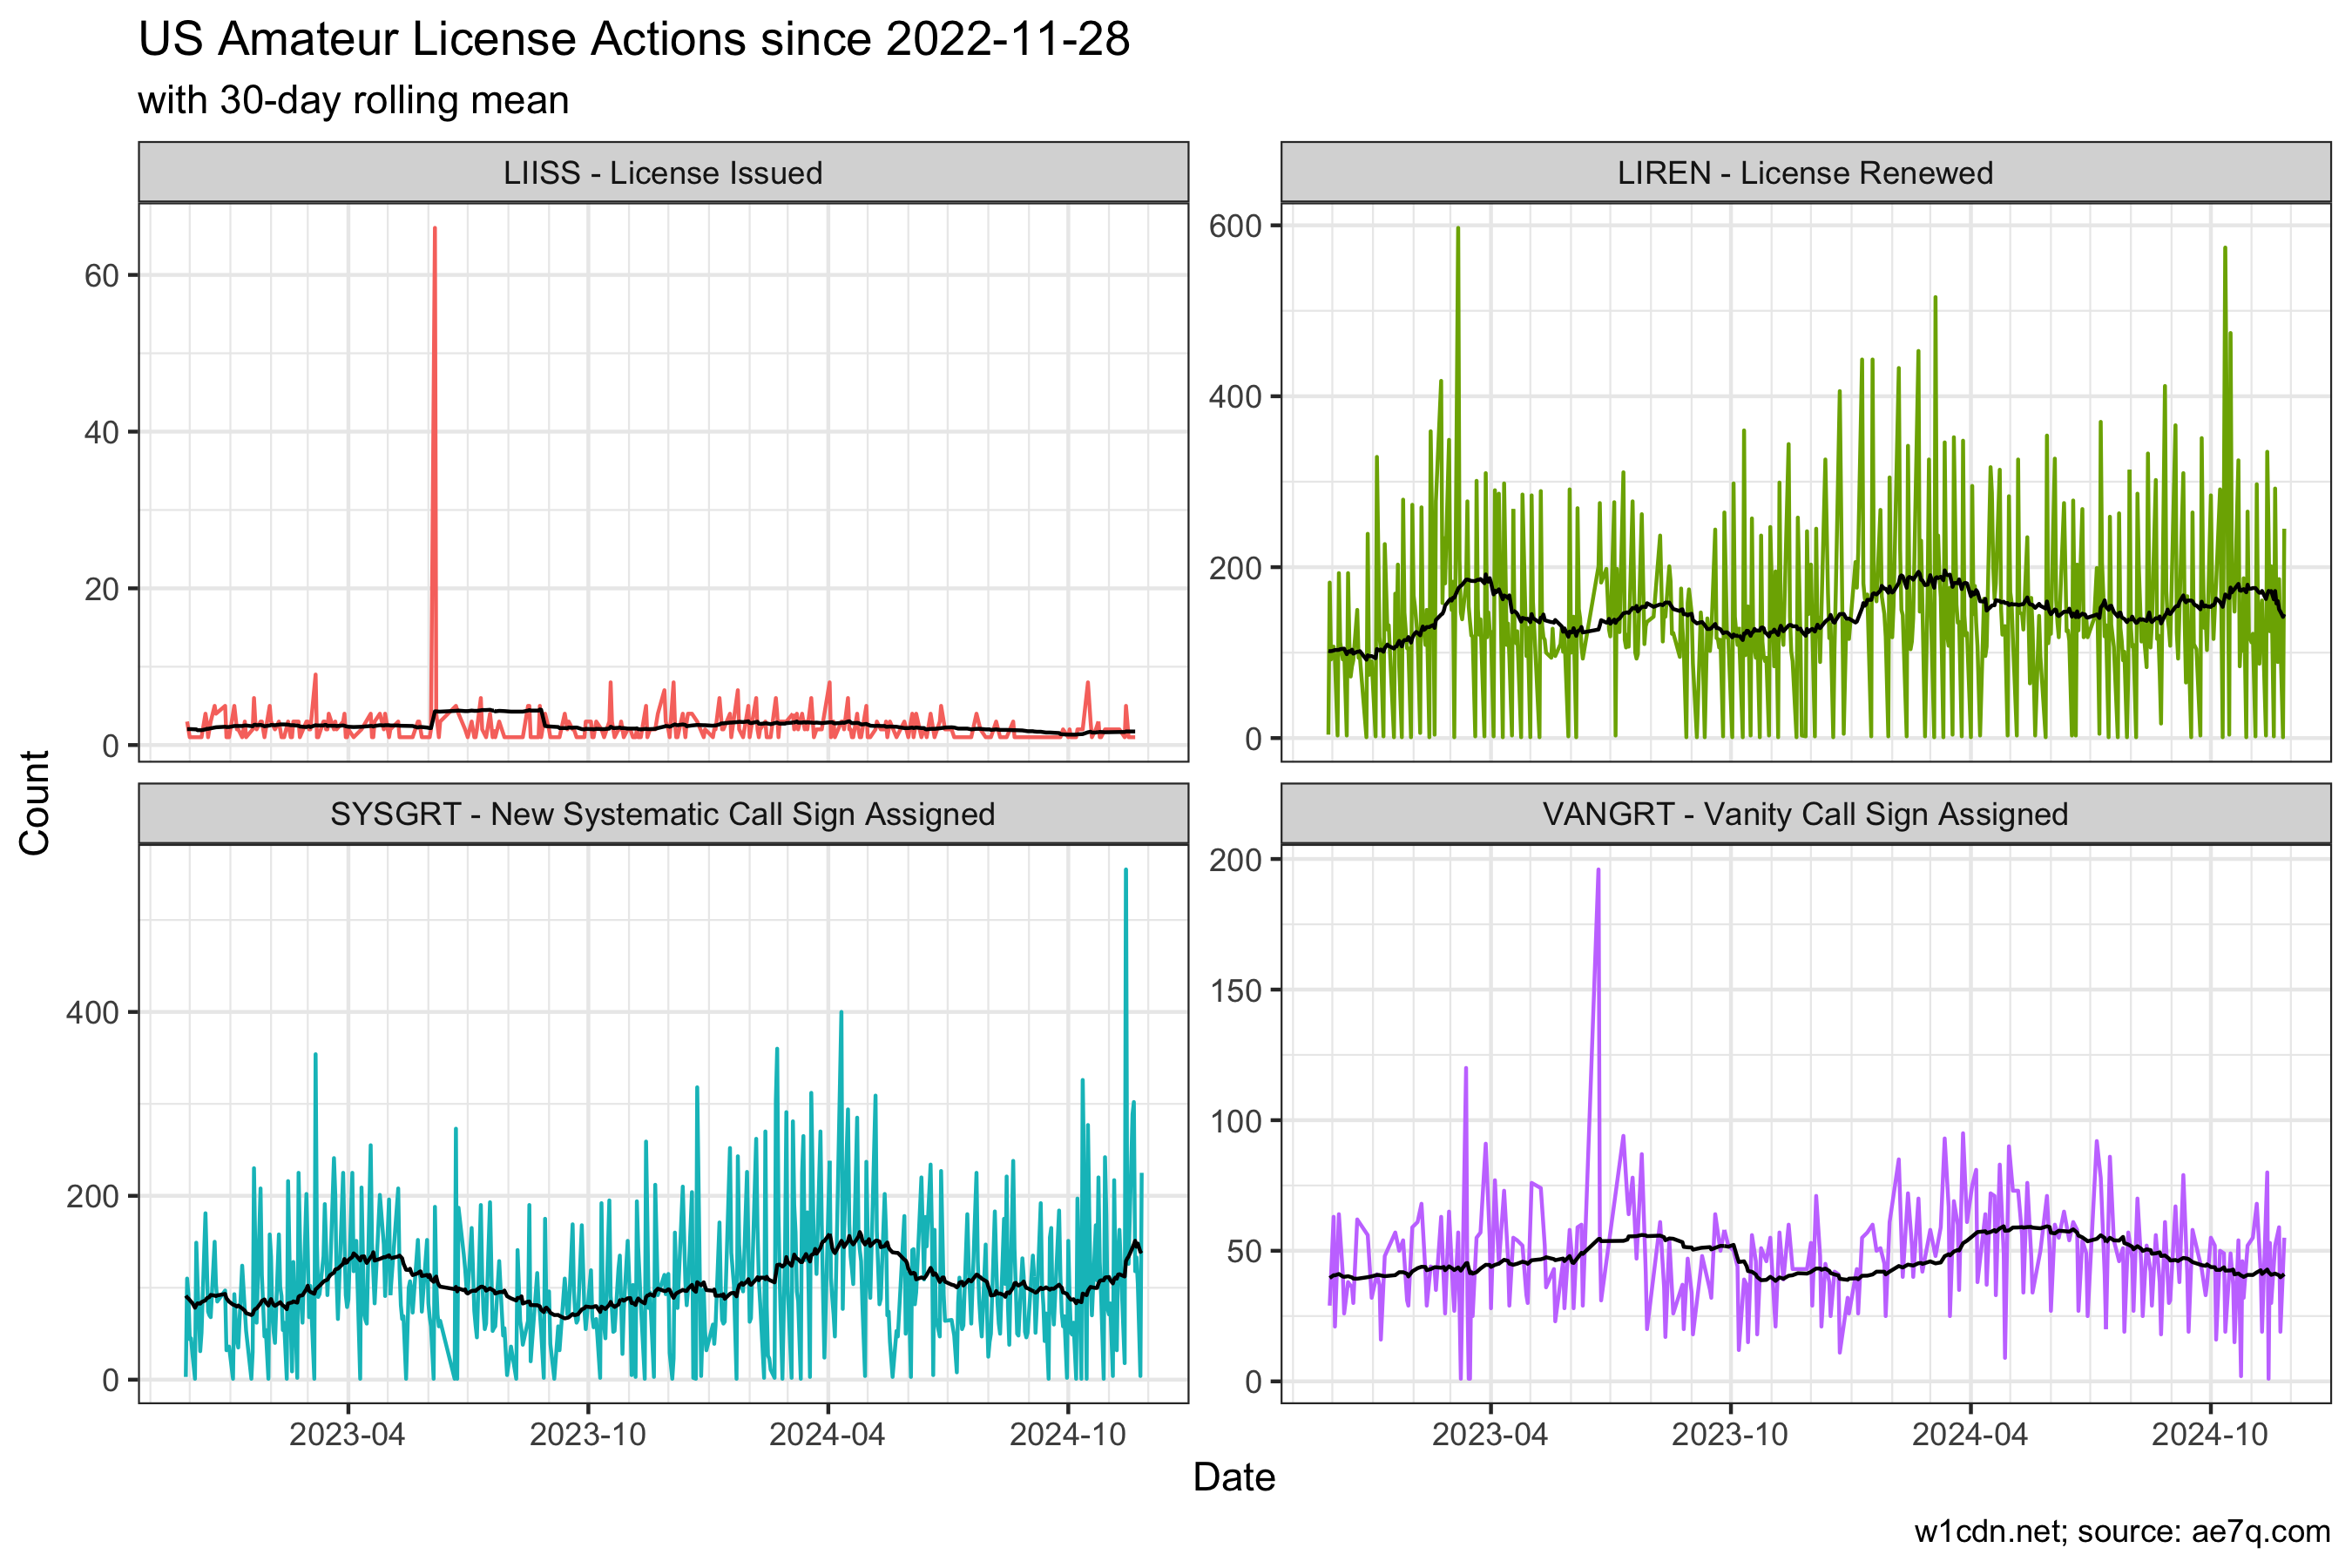
Rough Plots
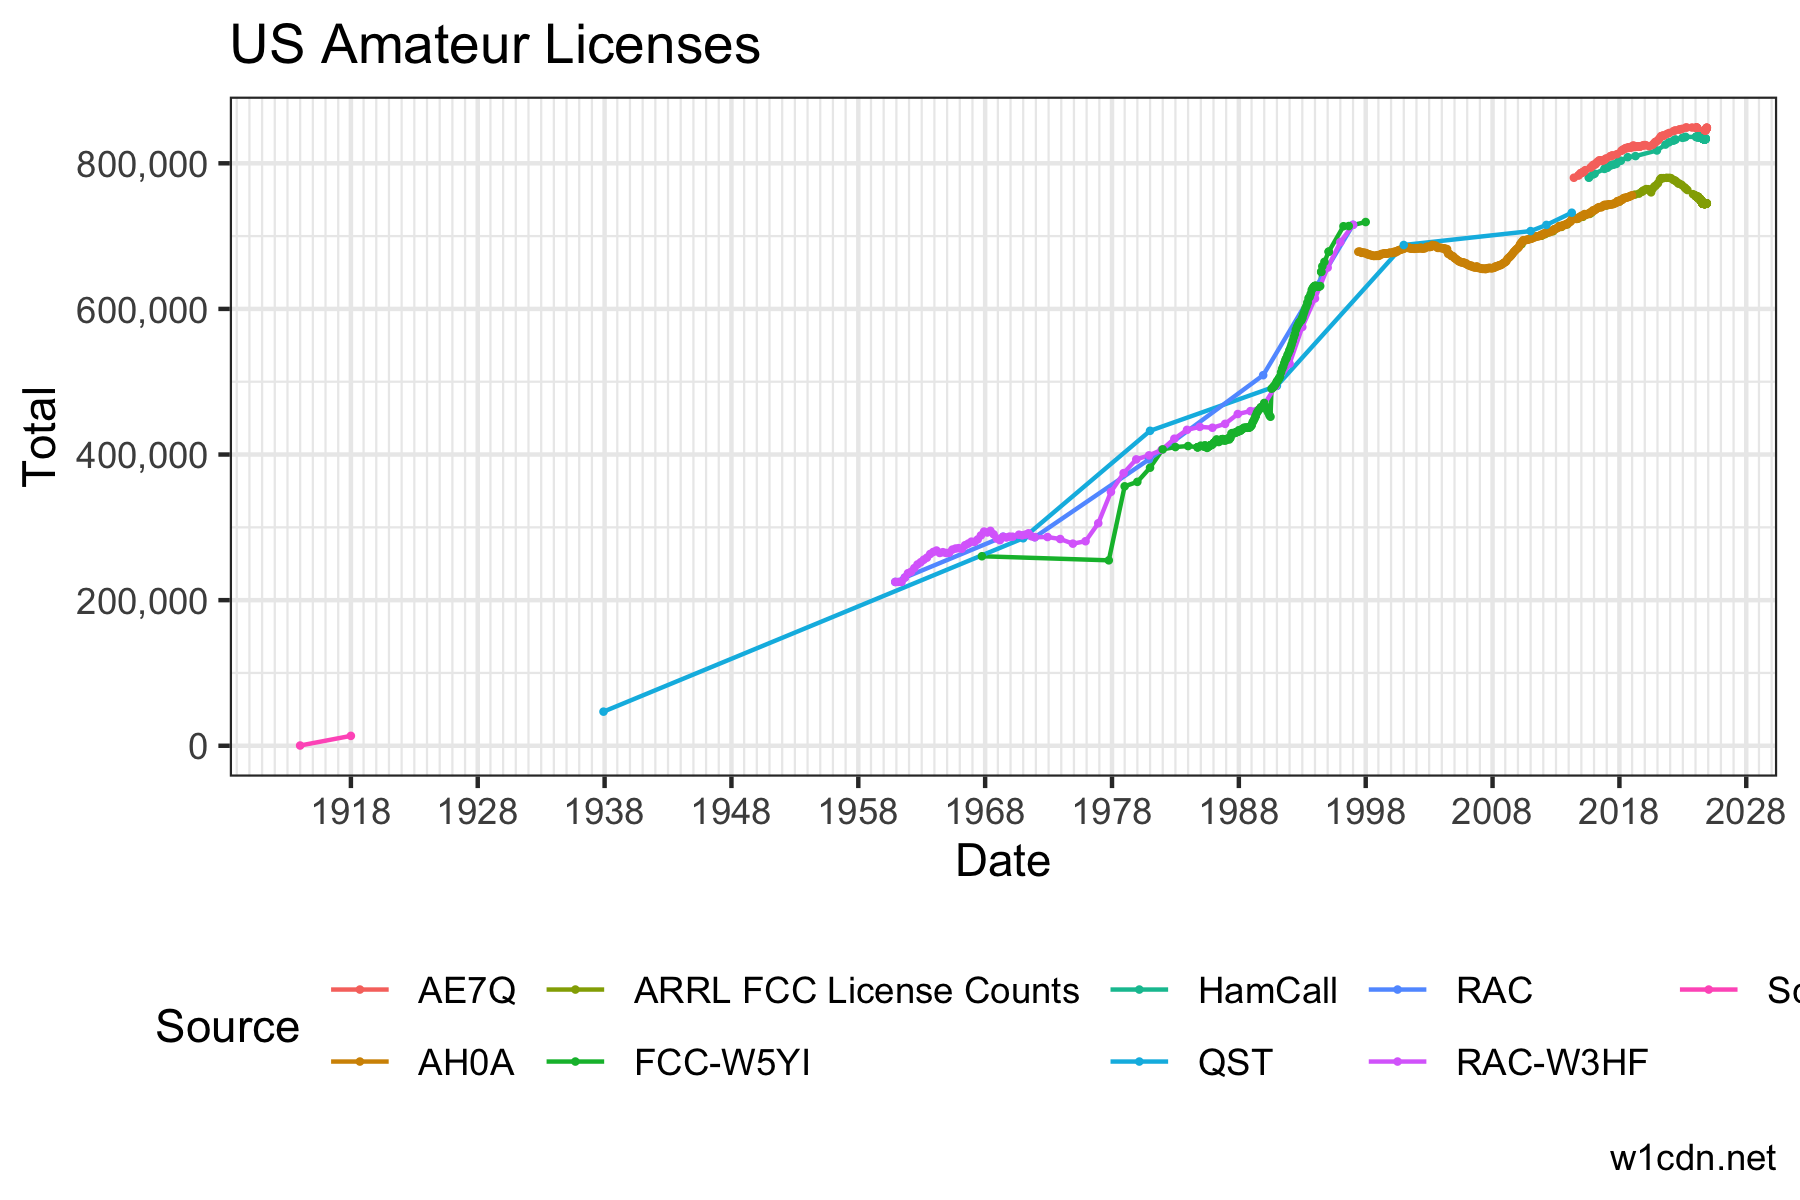
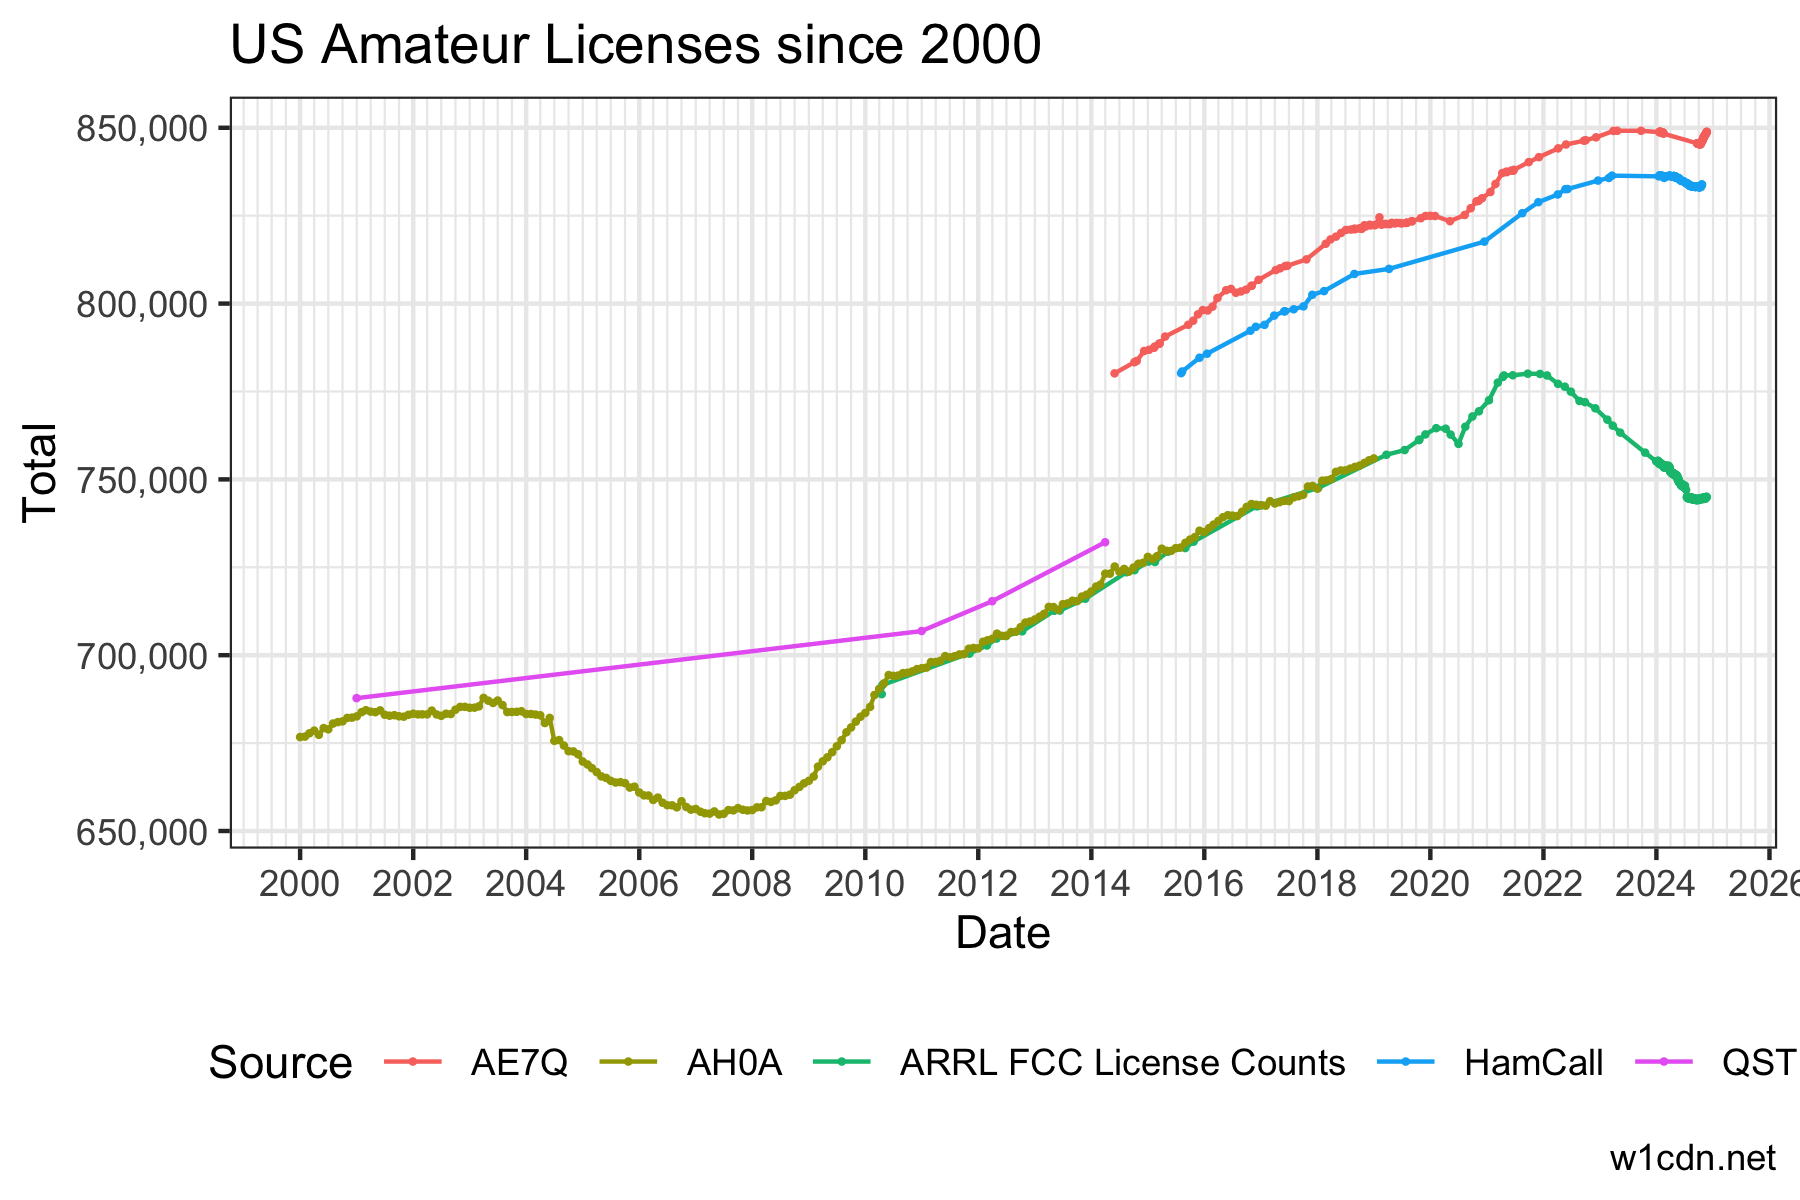
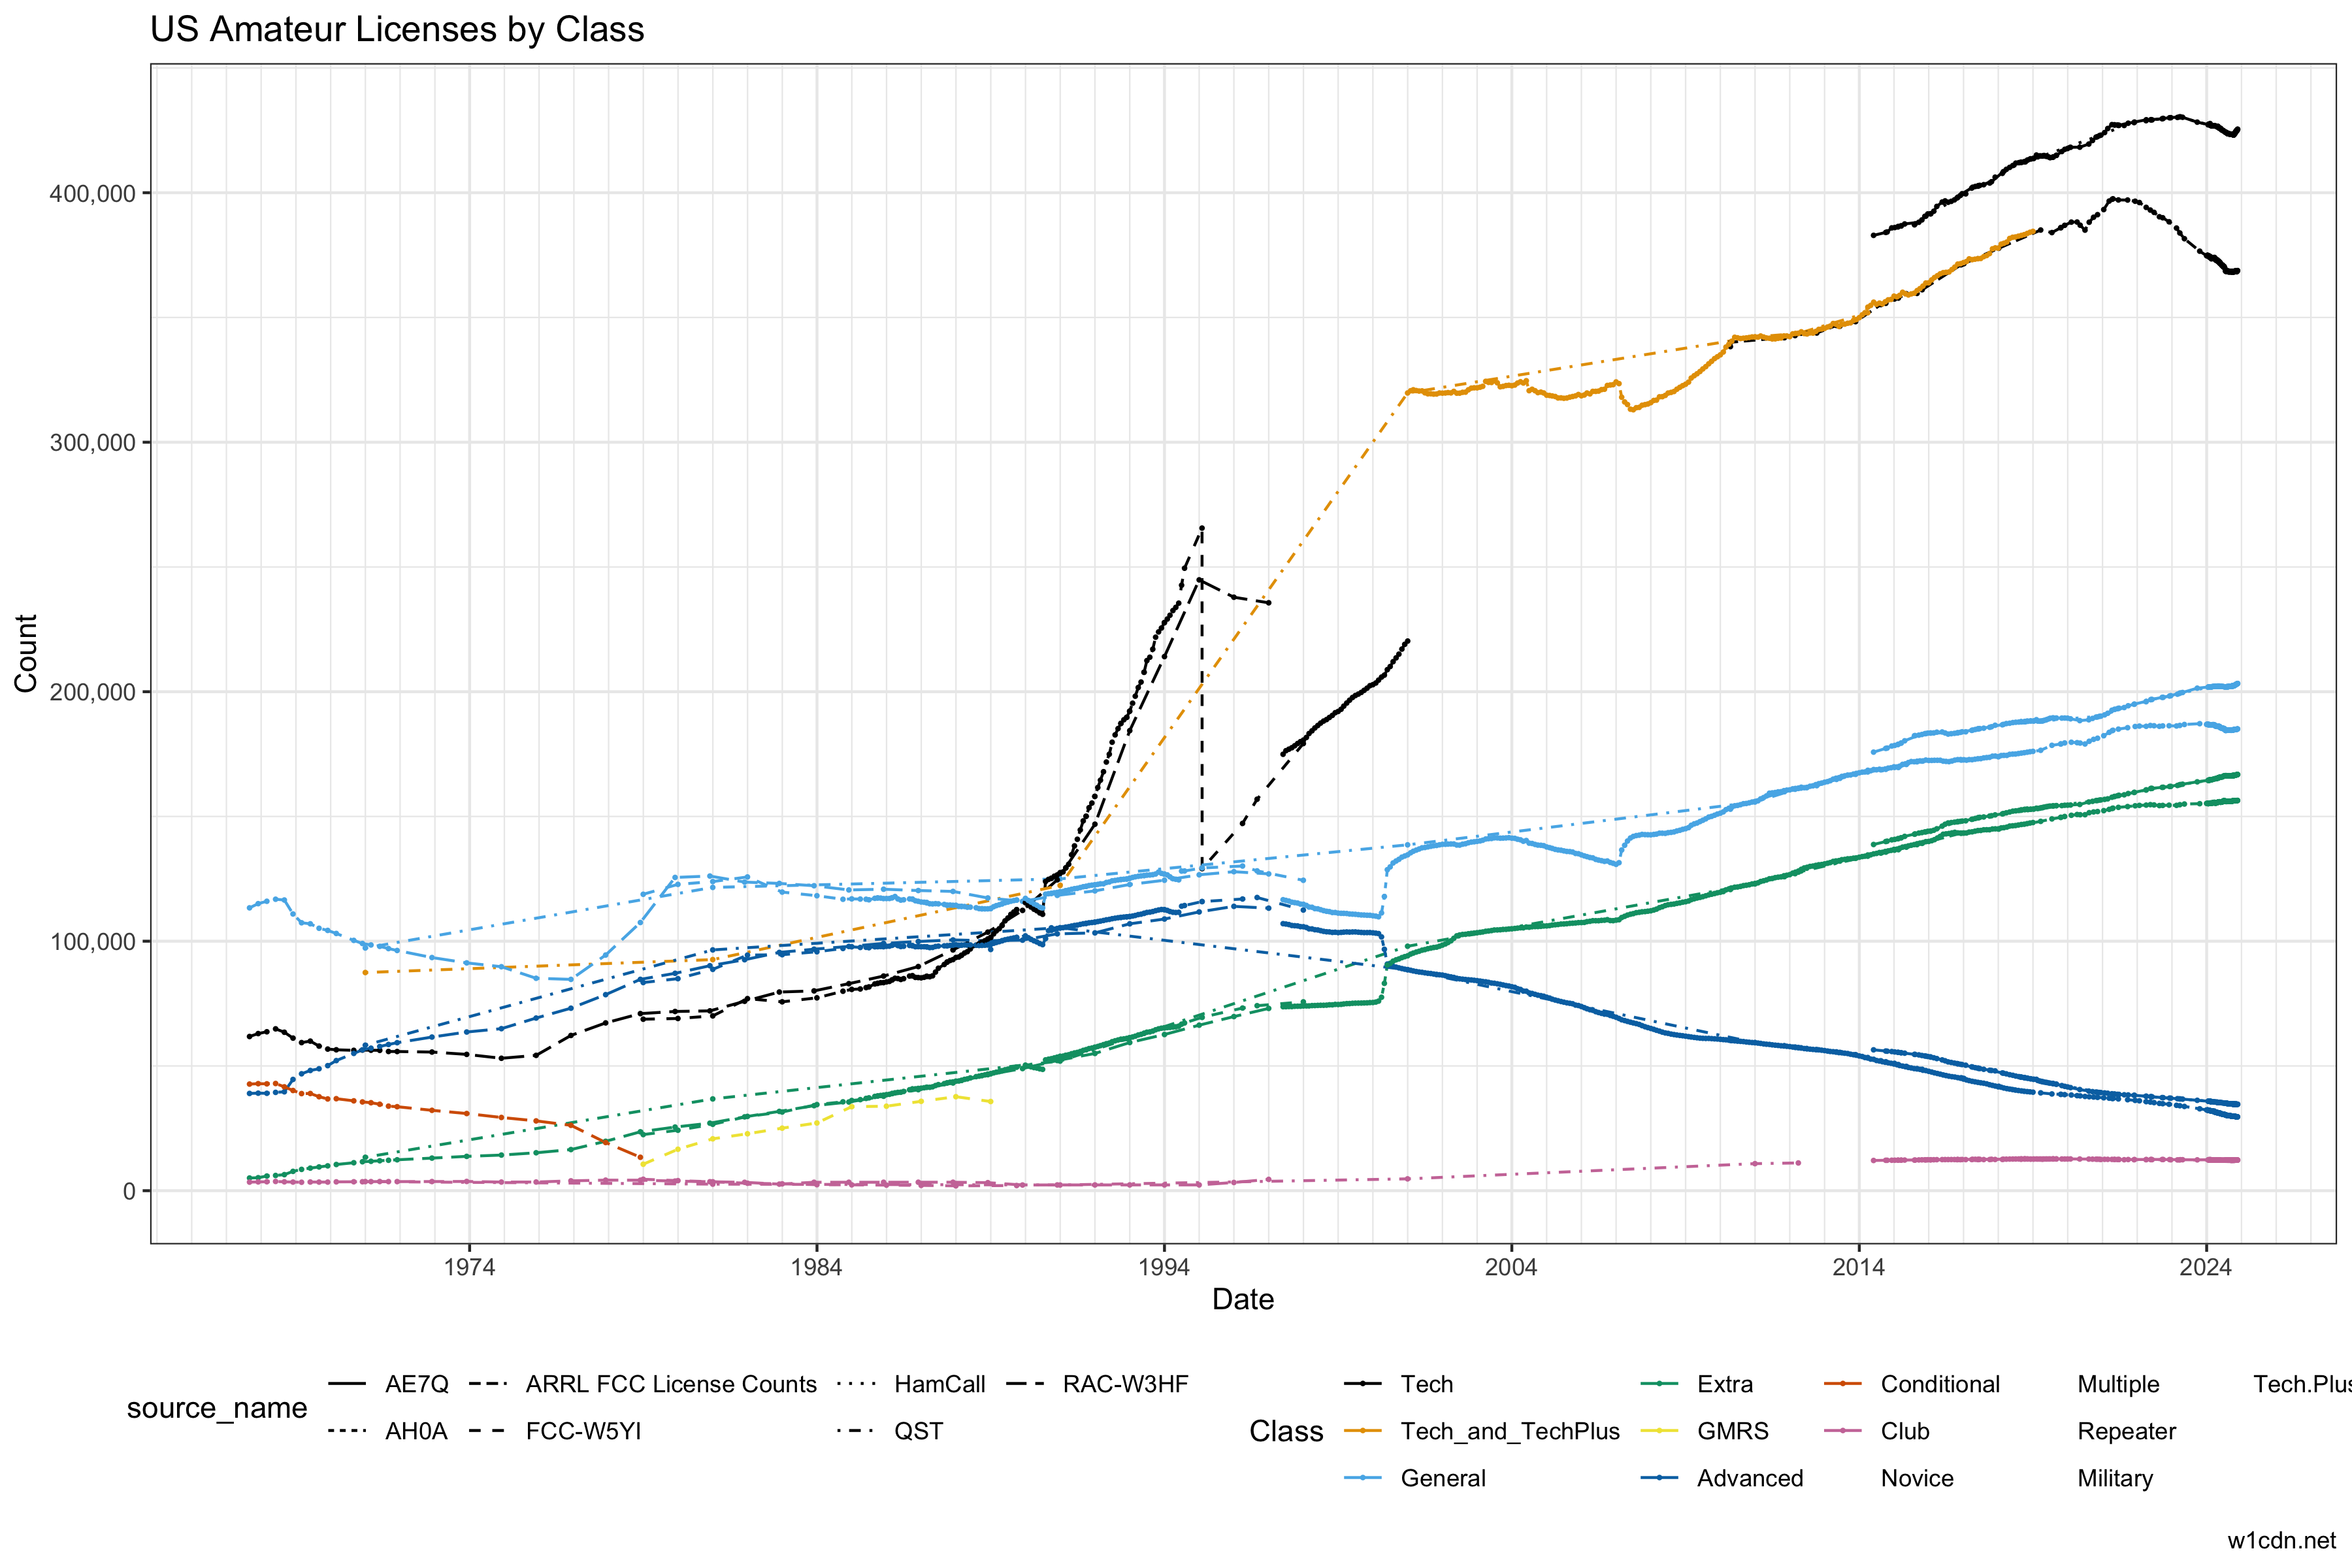
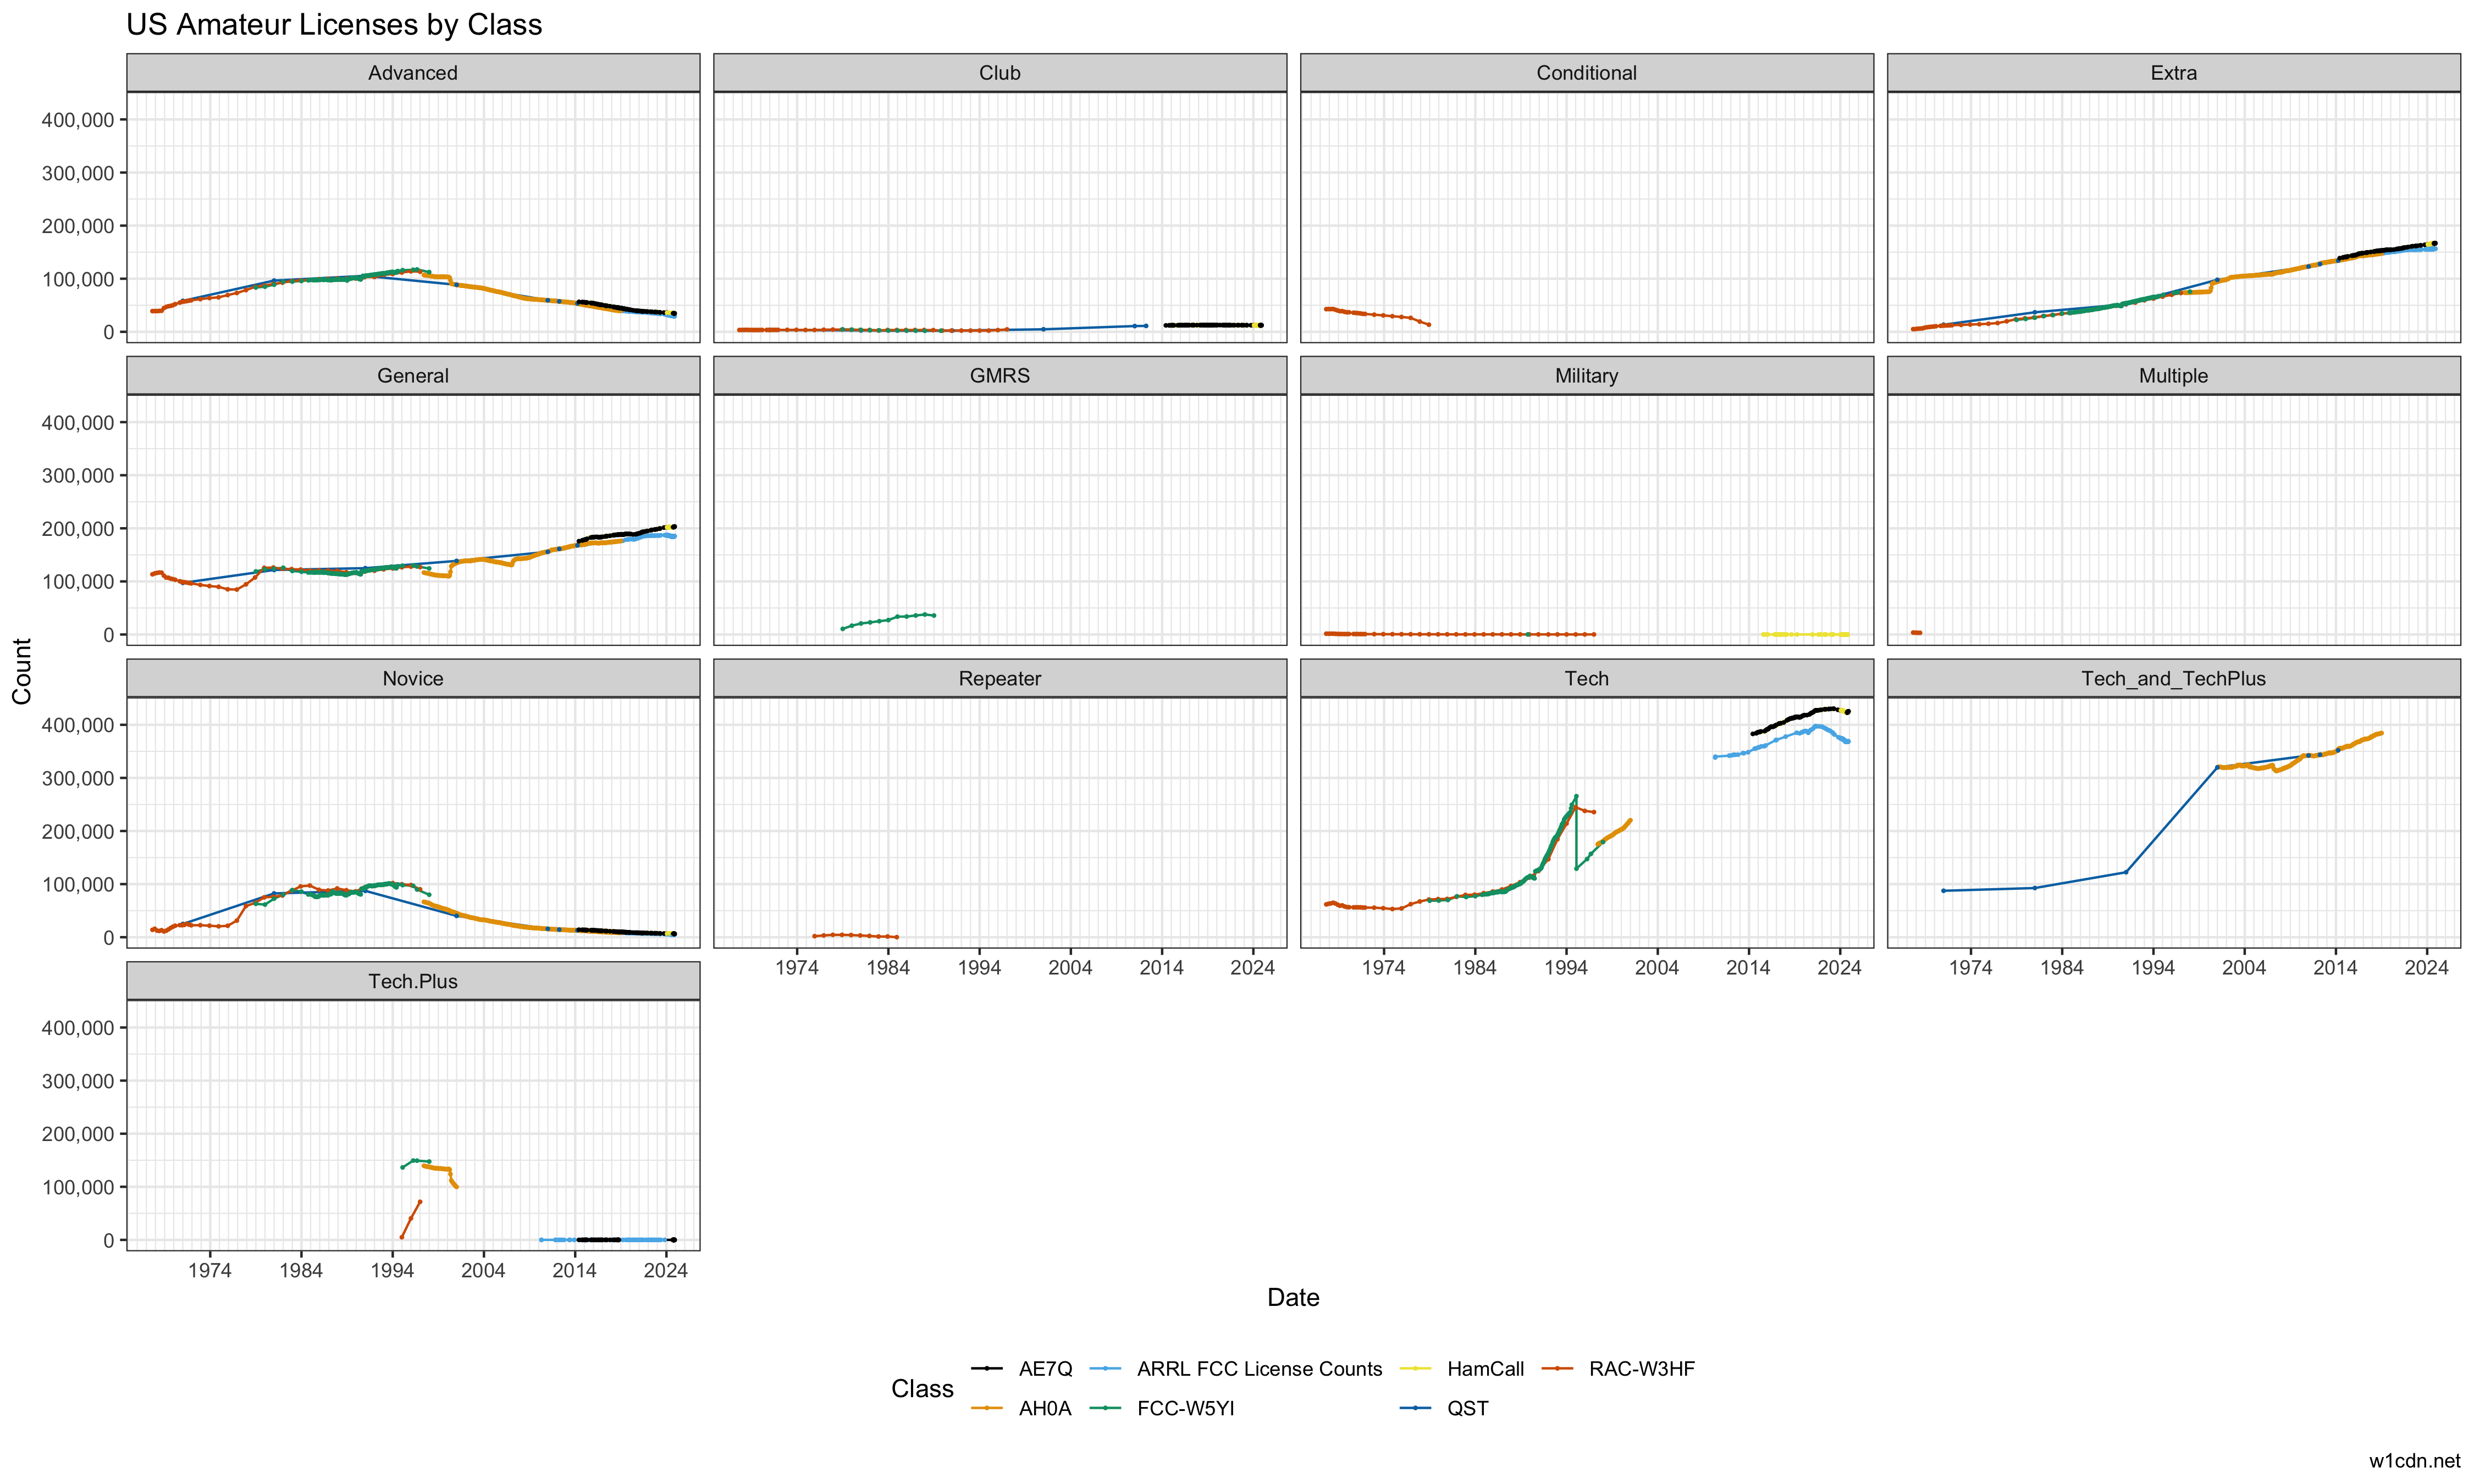
These are geneeral plots that aren't perfected every time the dataset is updated.
All the data in these plots is in https://amiok.net/gitea/W1CDN/ham-radio-licenses/src/branch/main/data.
