1f9cfb8f9c29e73532fc6249718526a1fc866791
Something going on here where the numbers change but the date on the page doesn't.
Overview
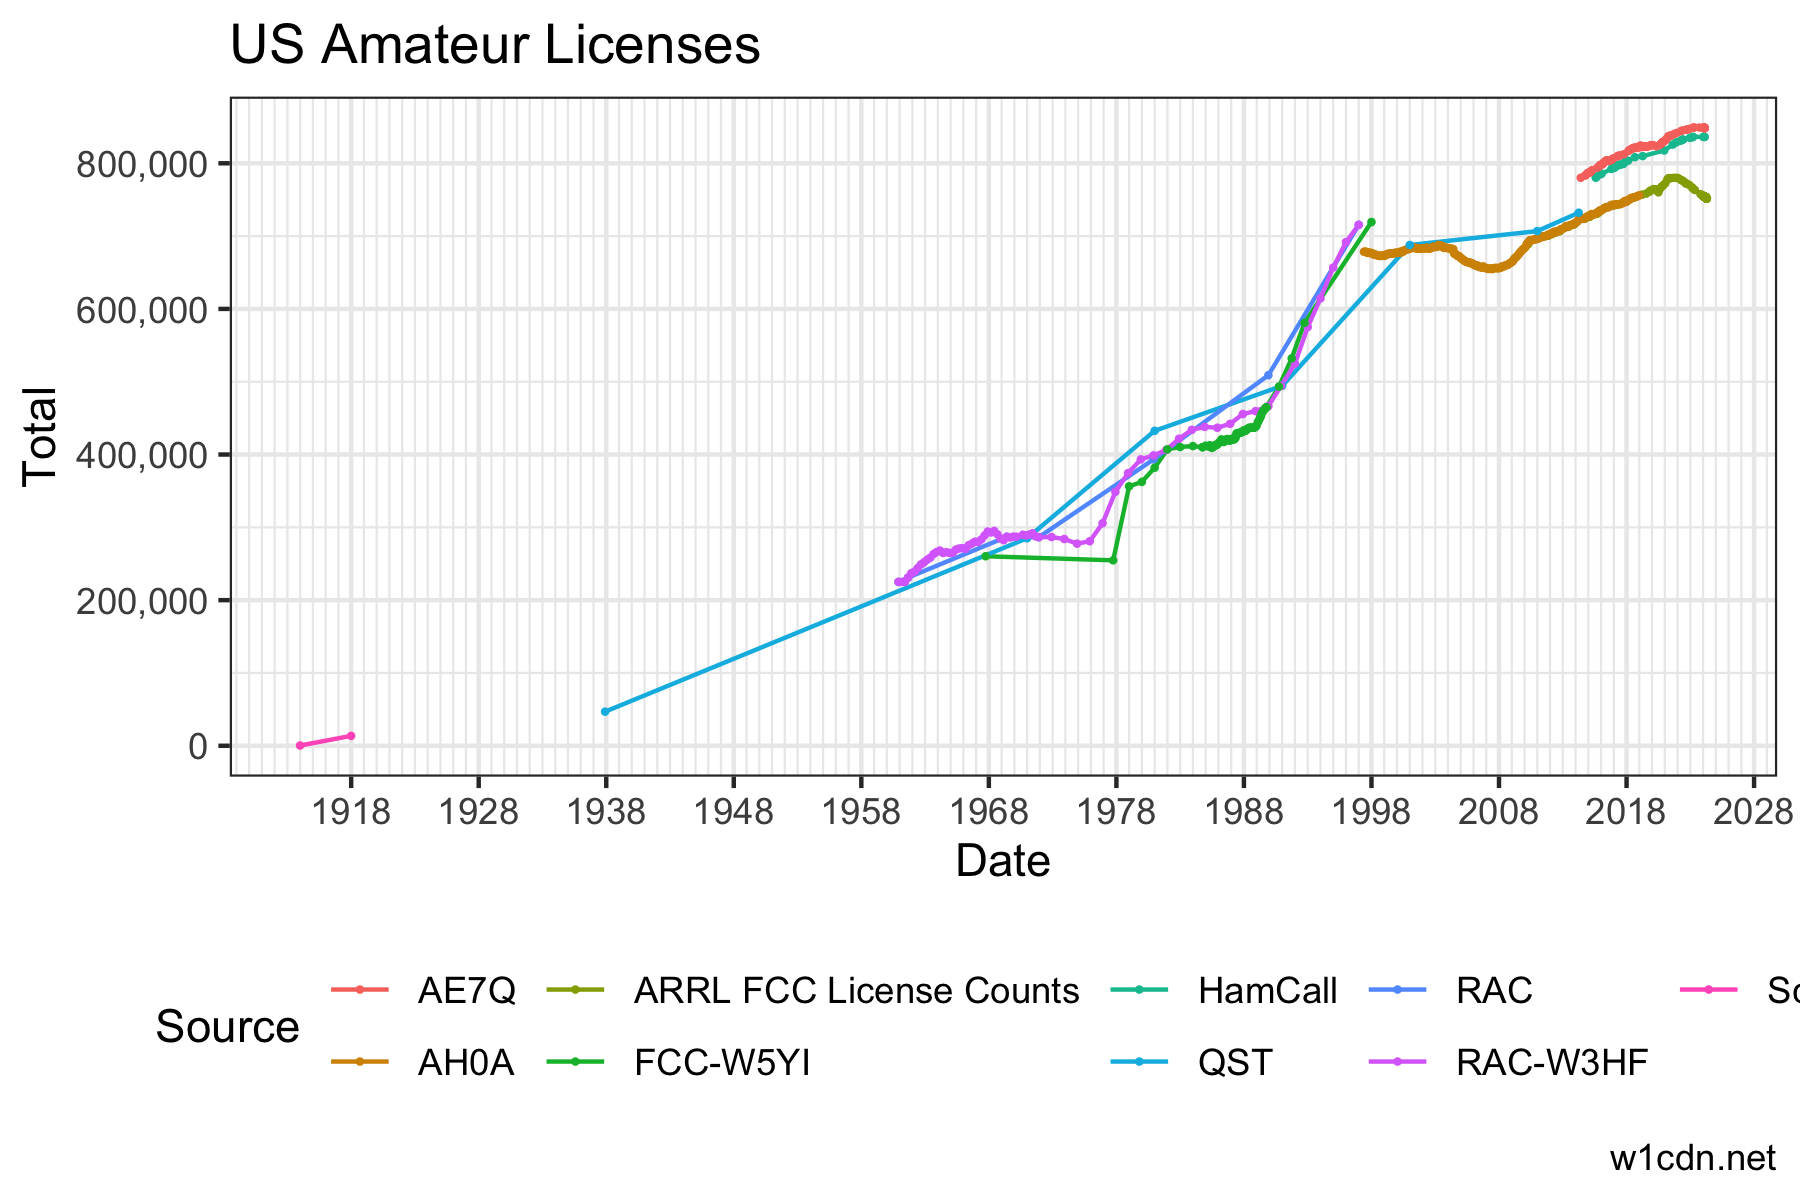
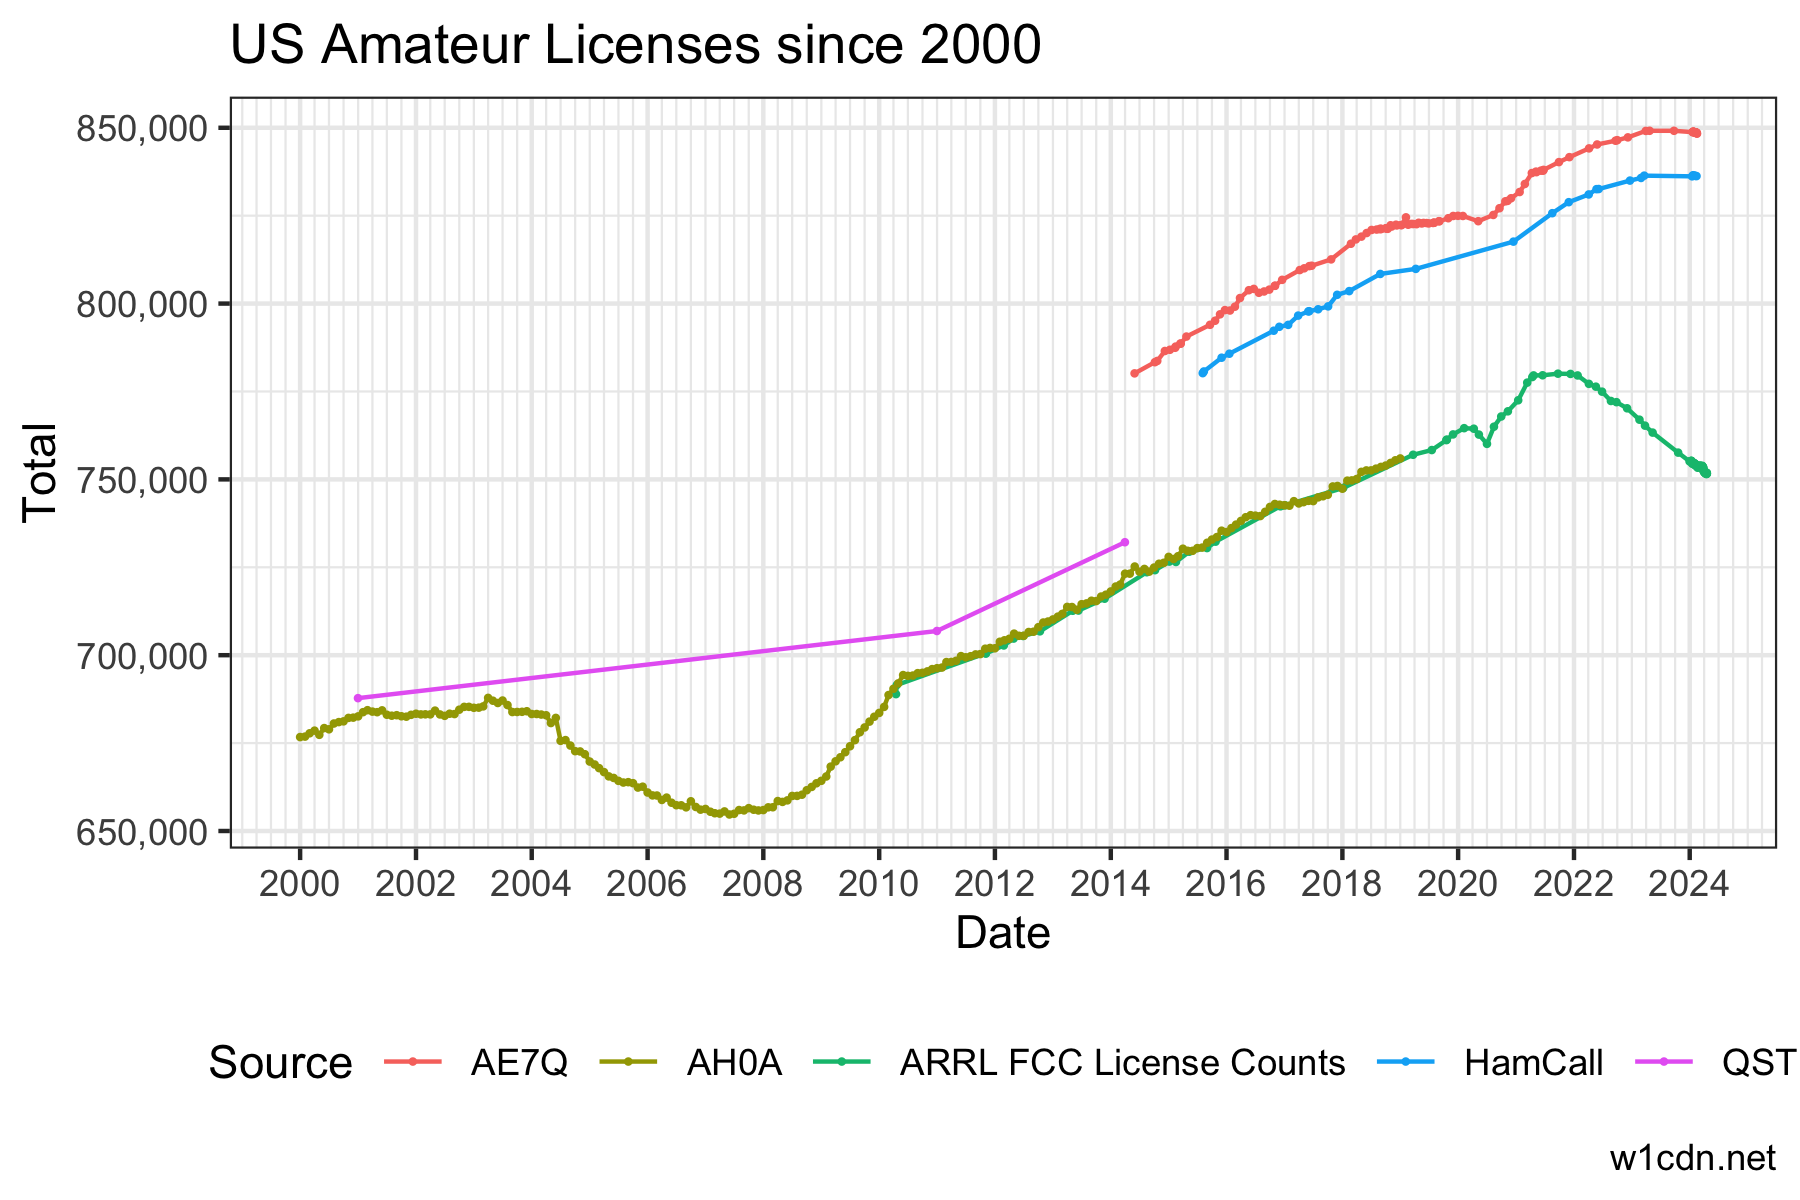
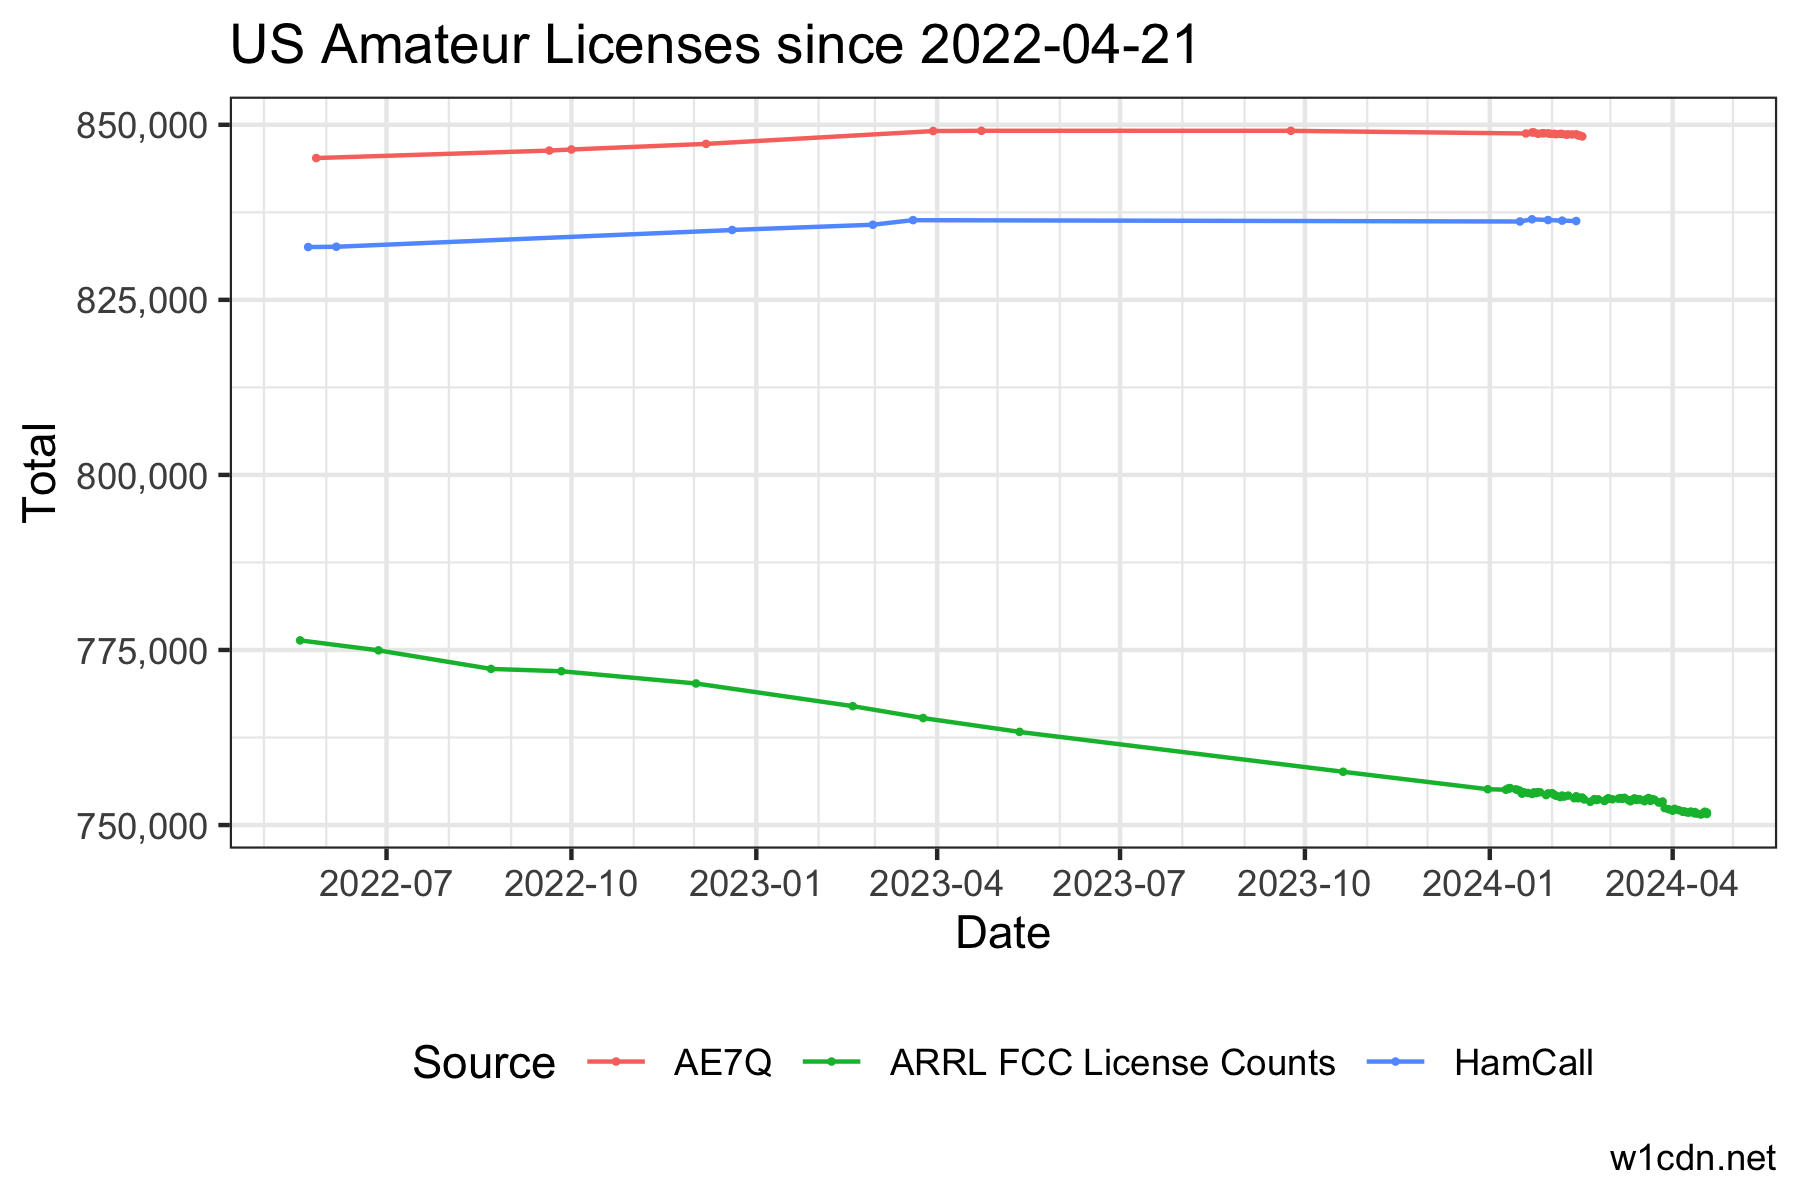
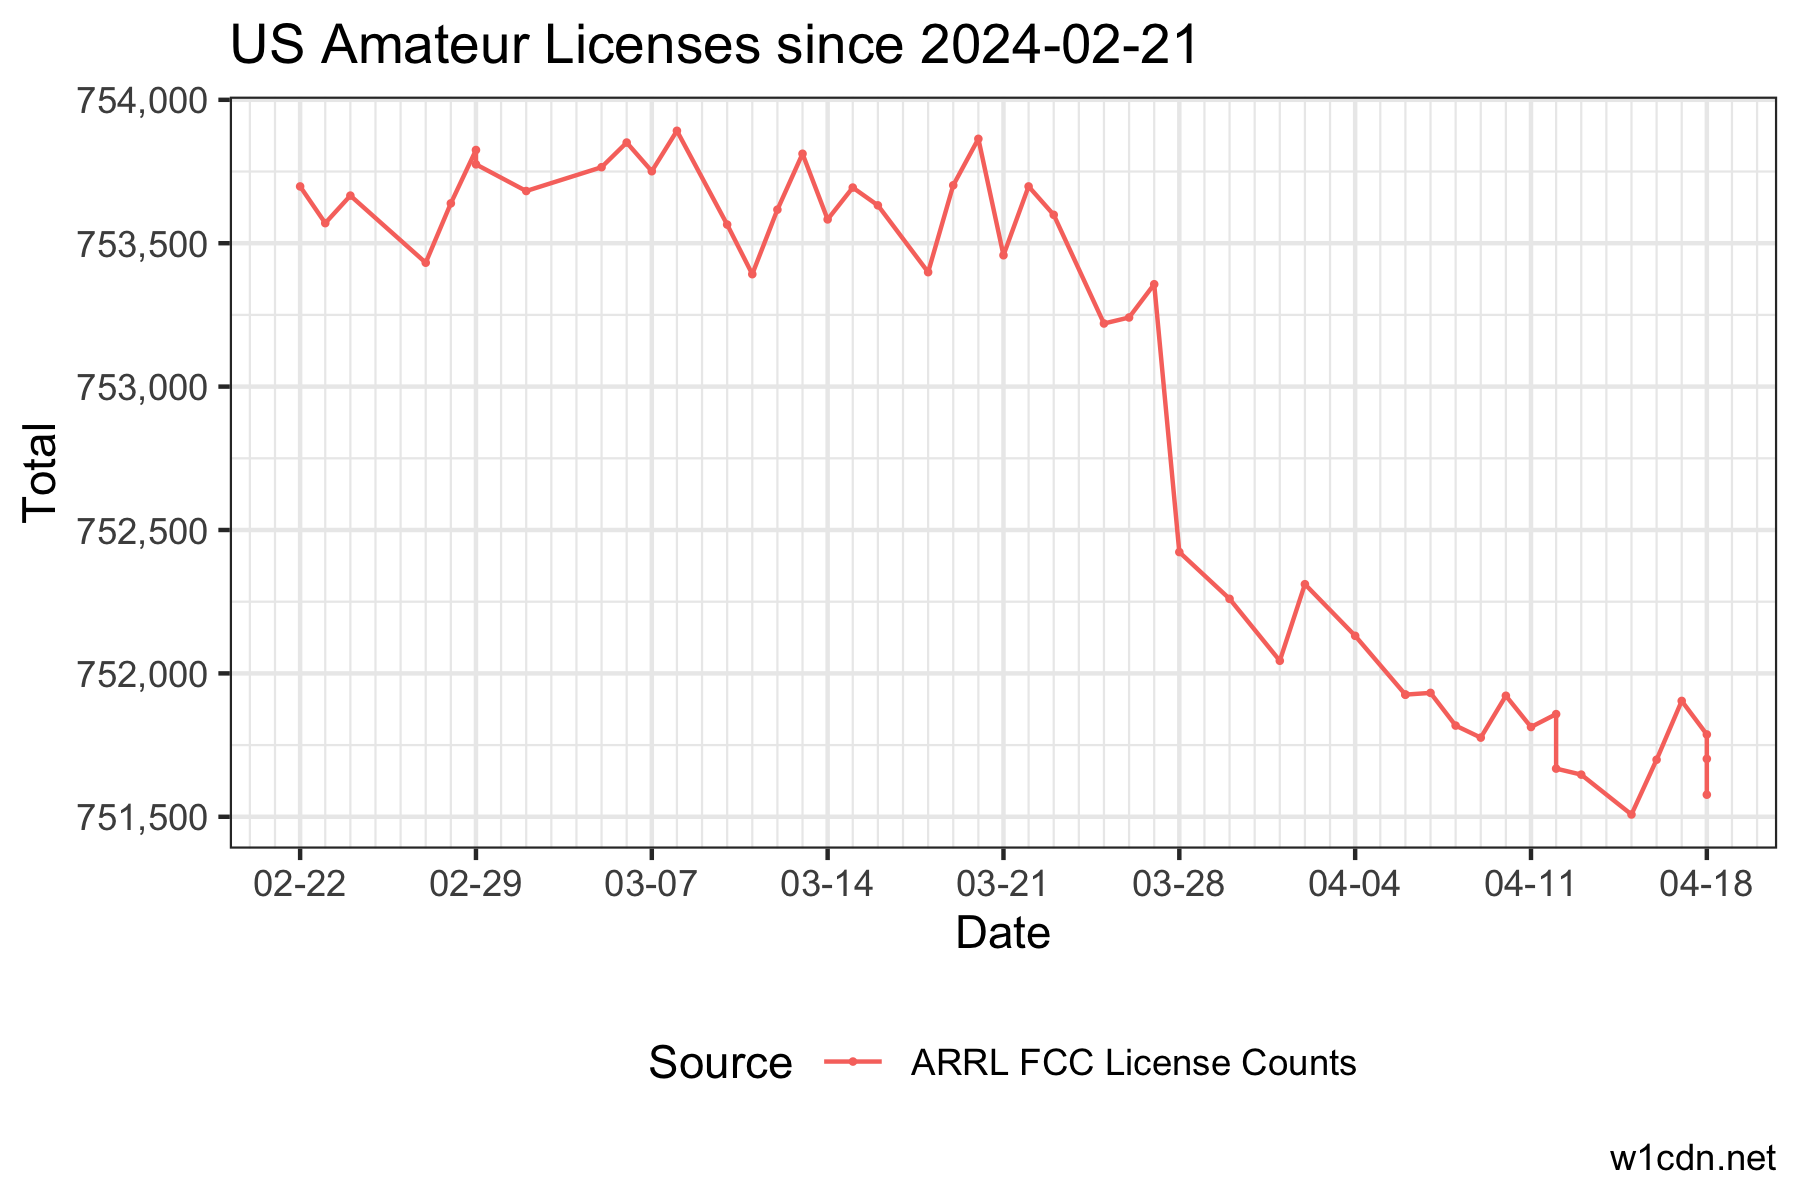
Data and code for analysis at https://mastodon.radio/@W1CDN/111723969200676208.
Introductory blog post: https://w1cdn.net/2024/01/us-ham-radio-license-counts-over-time/
This is a work in progress. It is not intended to be immediately useful for detailed analysis, but to act as a guide for further investigation. As we figure out how to slice up and caveat data, it will get more organized.
Resources (not all integrated yet)
- Various items in the issue queue
- Post from KE9V that started this: https://mastodon.sdf.org/@jdavis/111720350879036543
- Blog post: https://ke9v.net/2024/01/08/fading-away.html
- ARRL stats on the Internet Wayback Machine: https://web.archive.org/web/20150905095114/http://www.arrl.org/fcc-license-counts
- AH0A data from FCC
- Total stats: http://ah0a.org/FCC/Licenses.html
- Main page: http://ah0a.org/FCC/index.html
- FCC numbers as images of tables: https://sites.google.com/site/amateurradiodata/home
- K8VSY's per capita estimates: https://k8vsy.radio/2021/09/ham-radio-licenses-us-states-per-capita.html
Contributing
I am trying to stage new data in the issues list, then copy that data into tabular format at a later date.
If you want to help, here are some ways:
- look at the issues and copy data into tabular format, share back in CSV format or pull request
- find new sources and create an issue for each new chunk of data (use best judgement)
- download data and QC: look for potential errors and inconsistencies, share those in a new issue
- download data and run analyses: share your interpretations
- choose your own way to contribute!
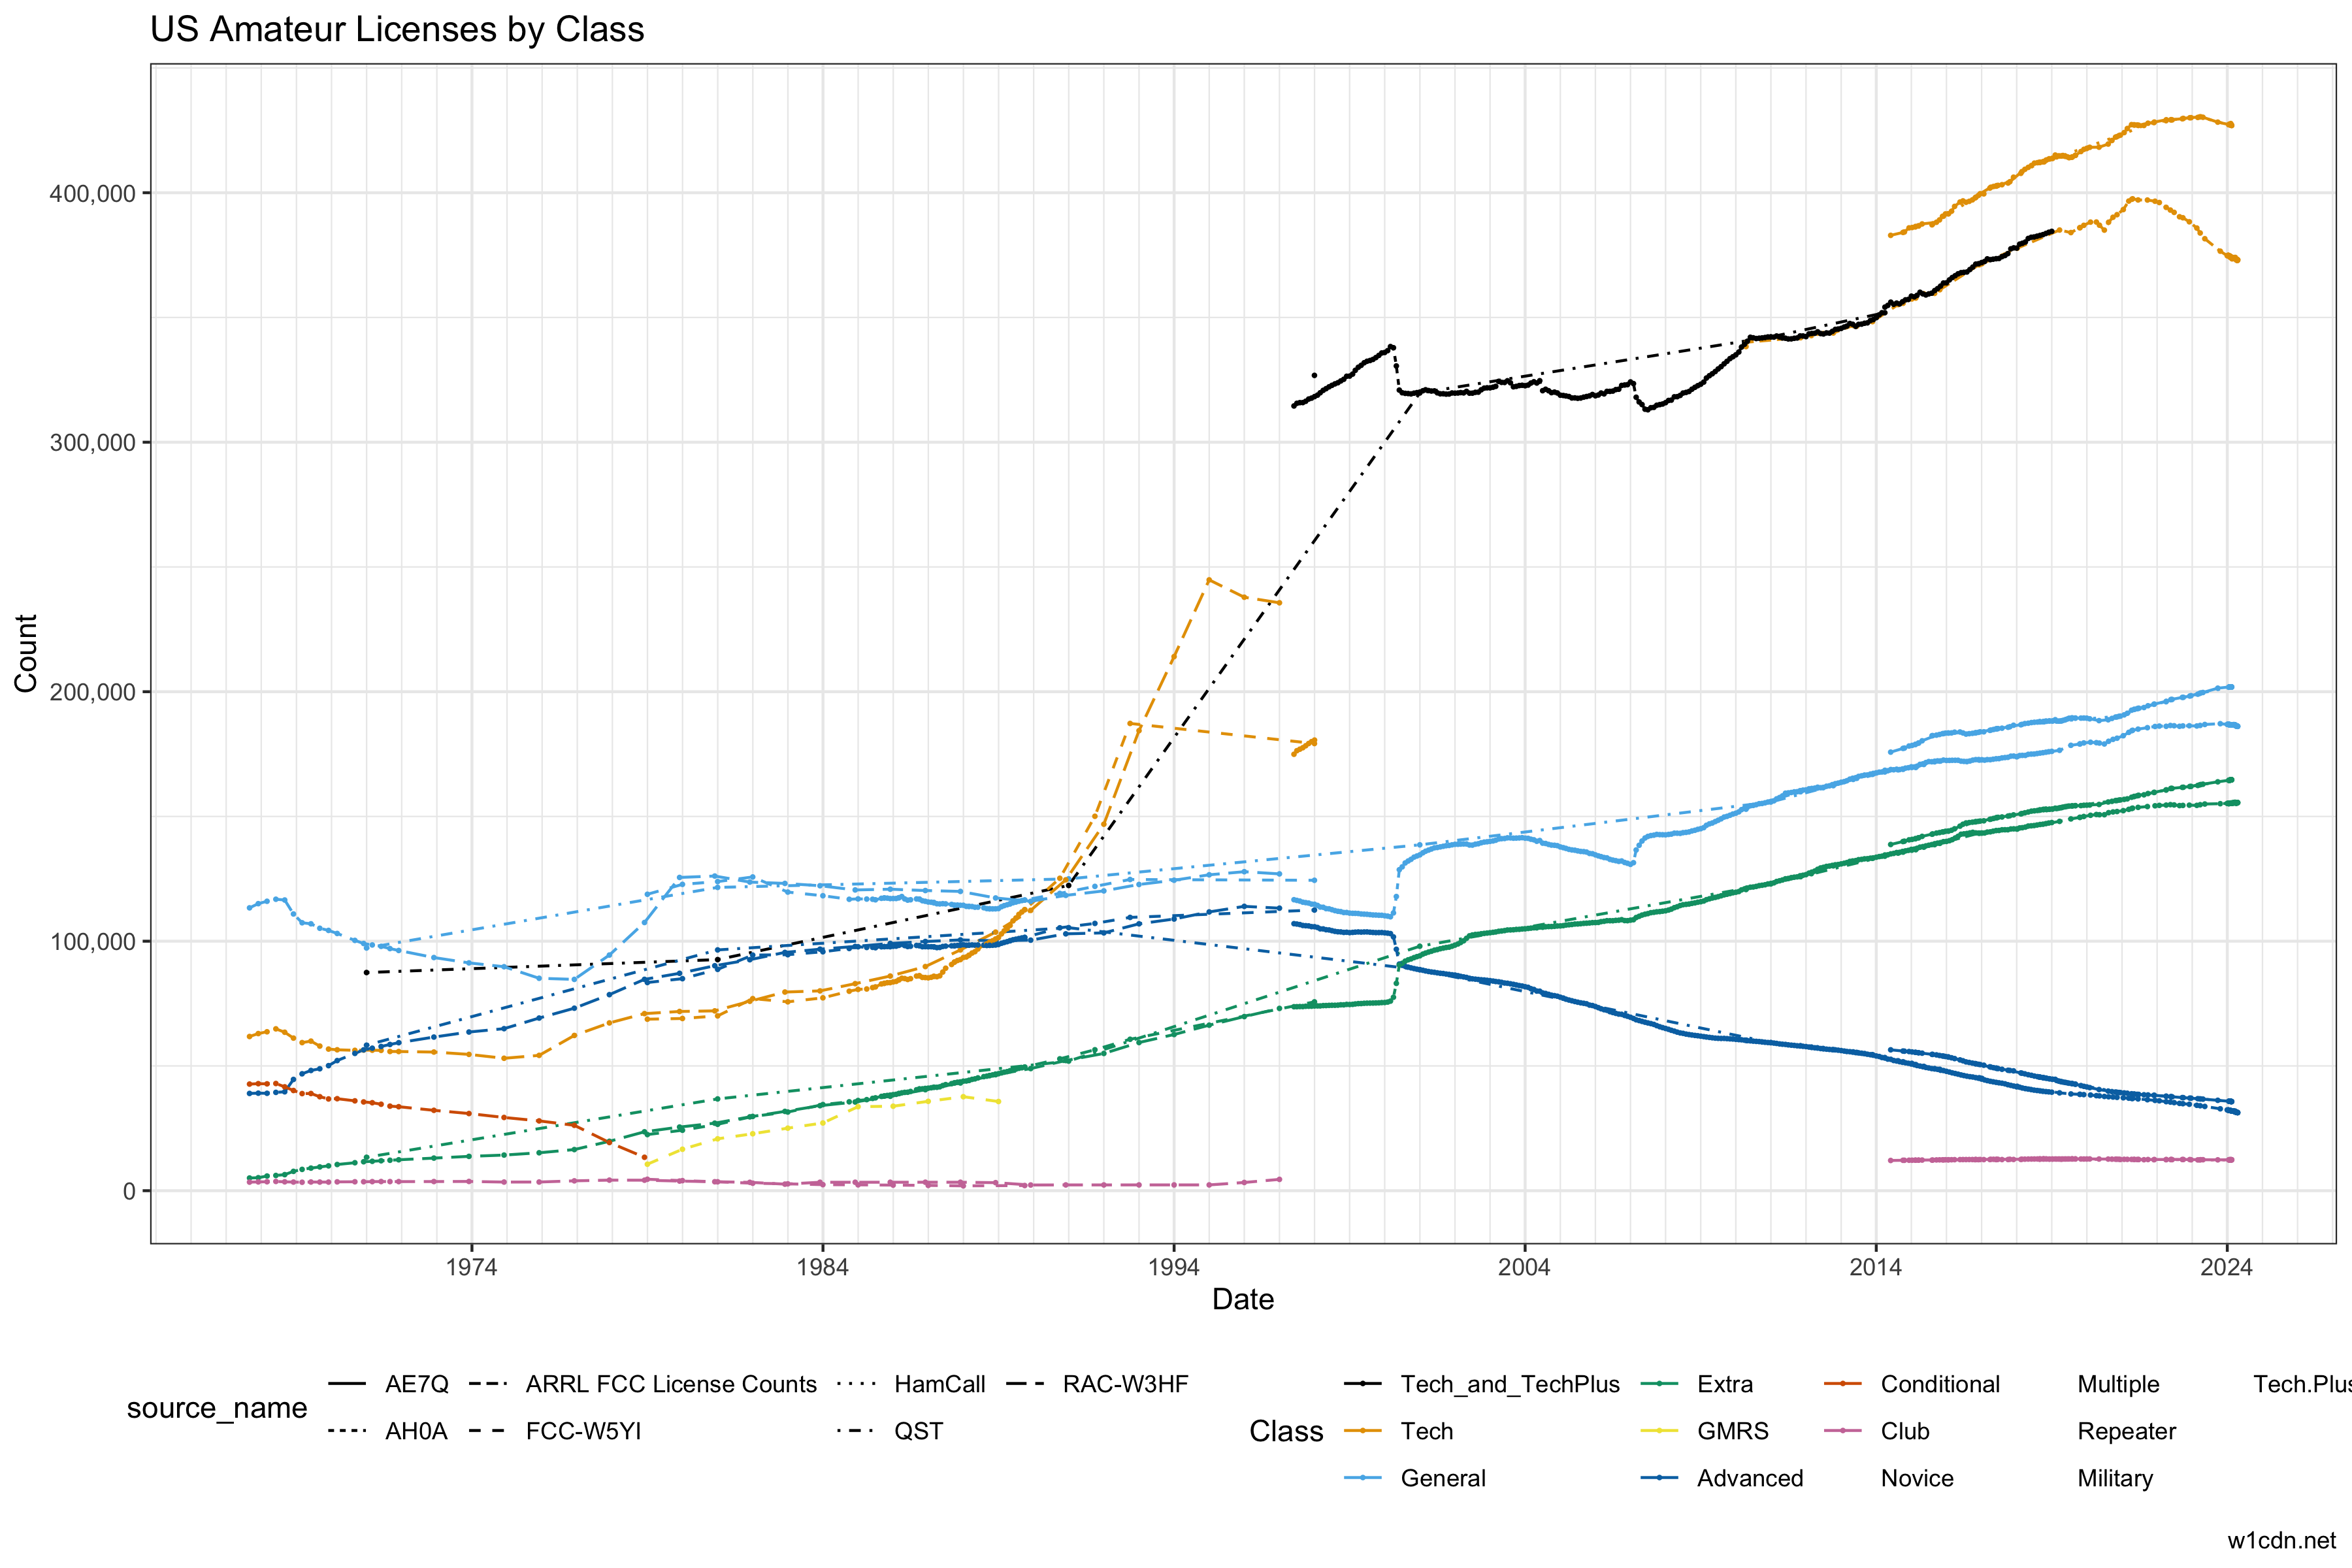
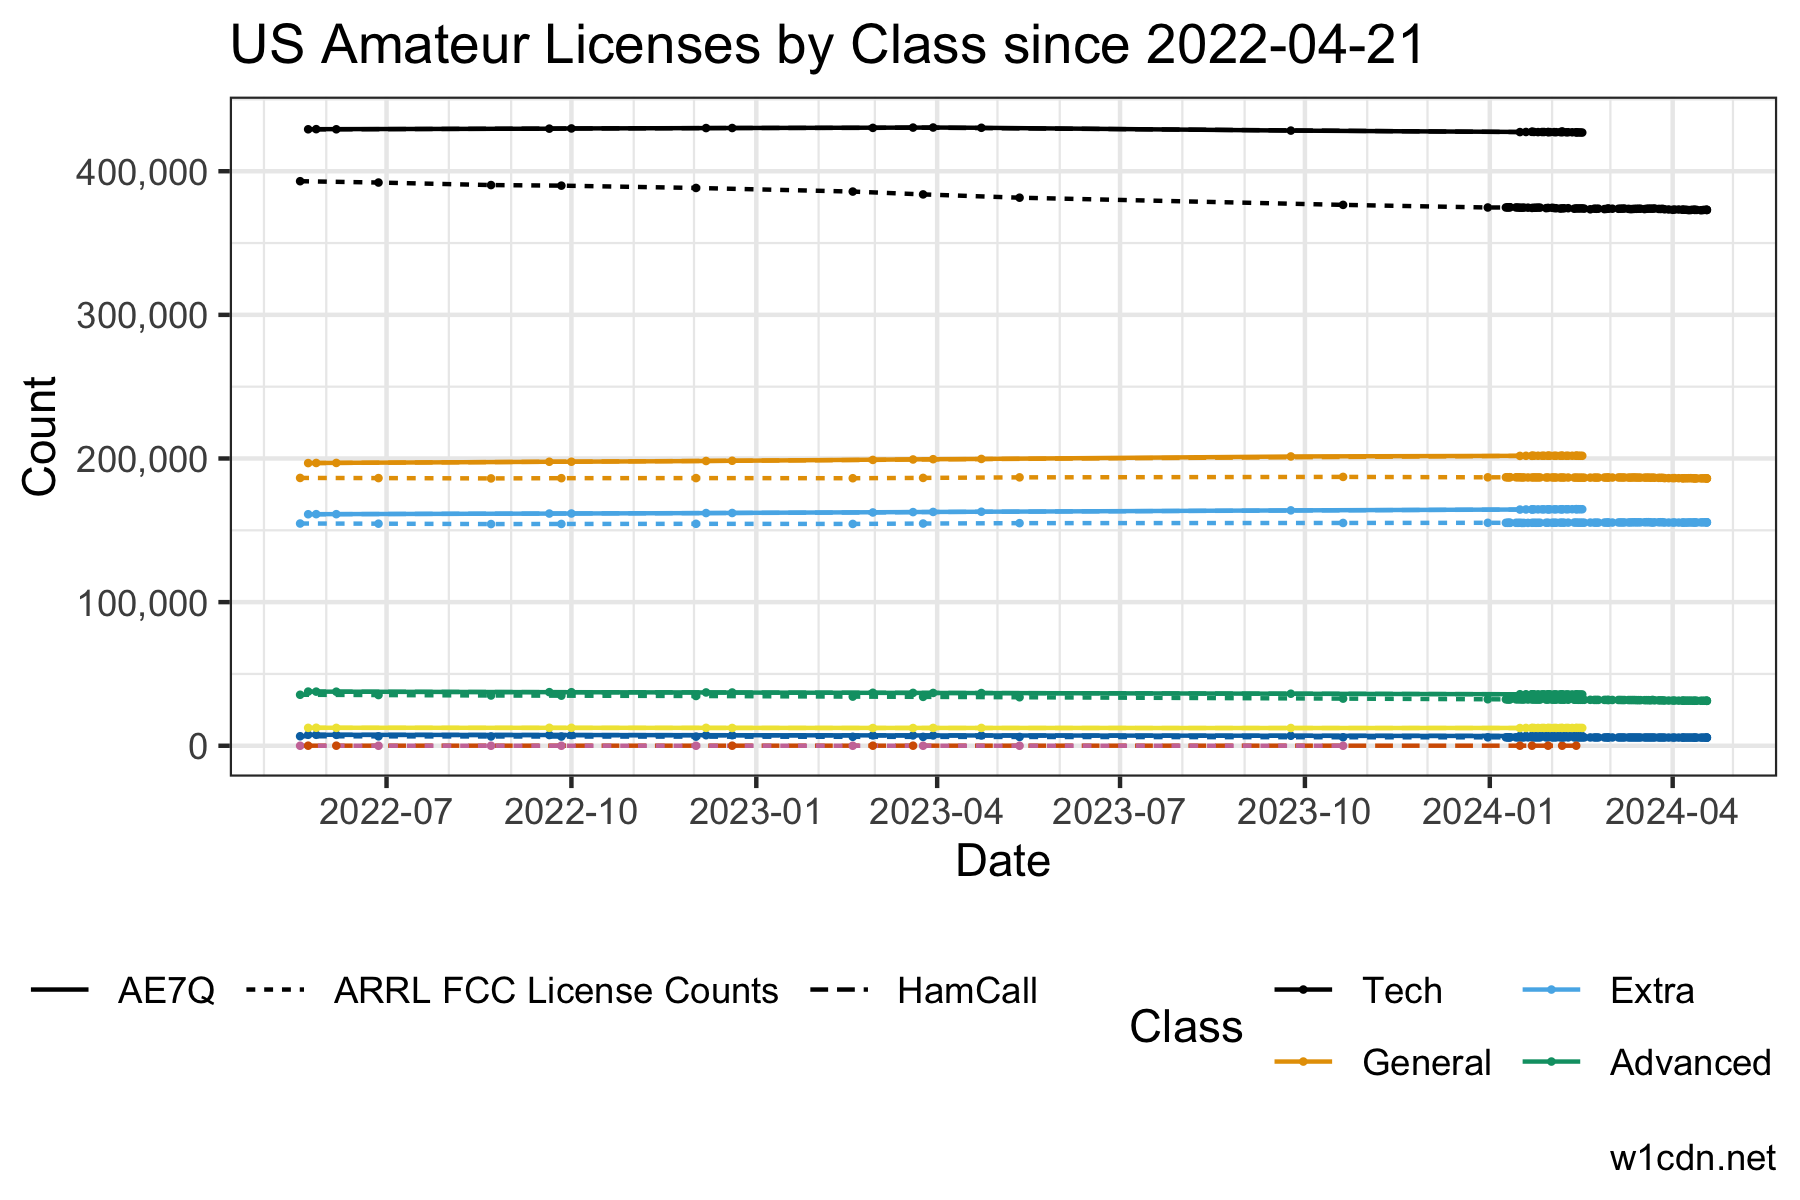
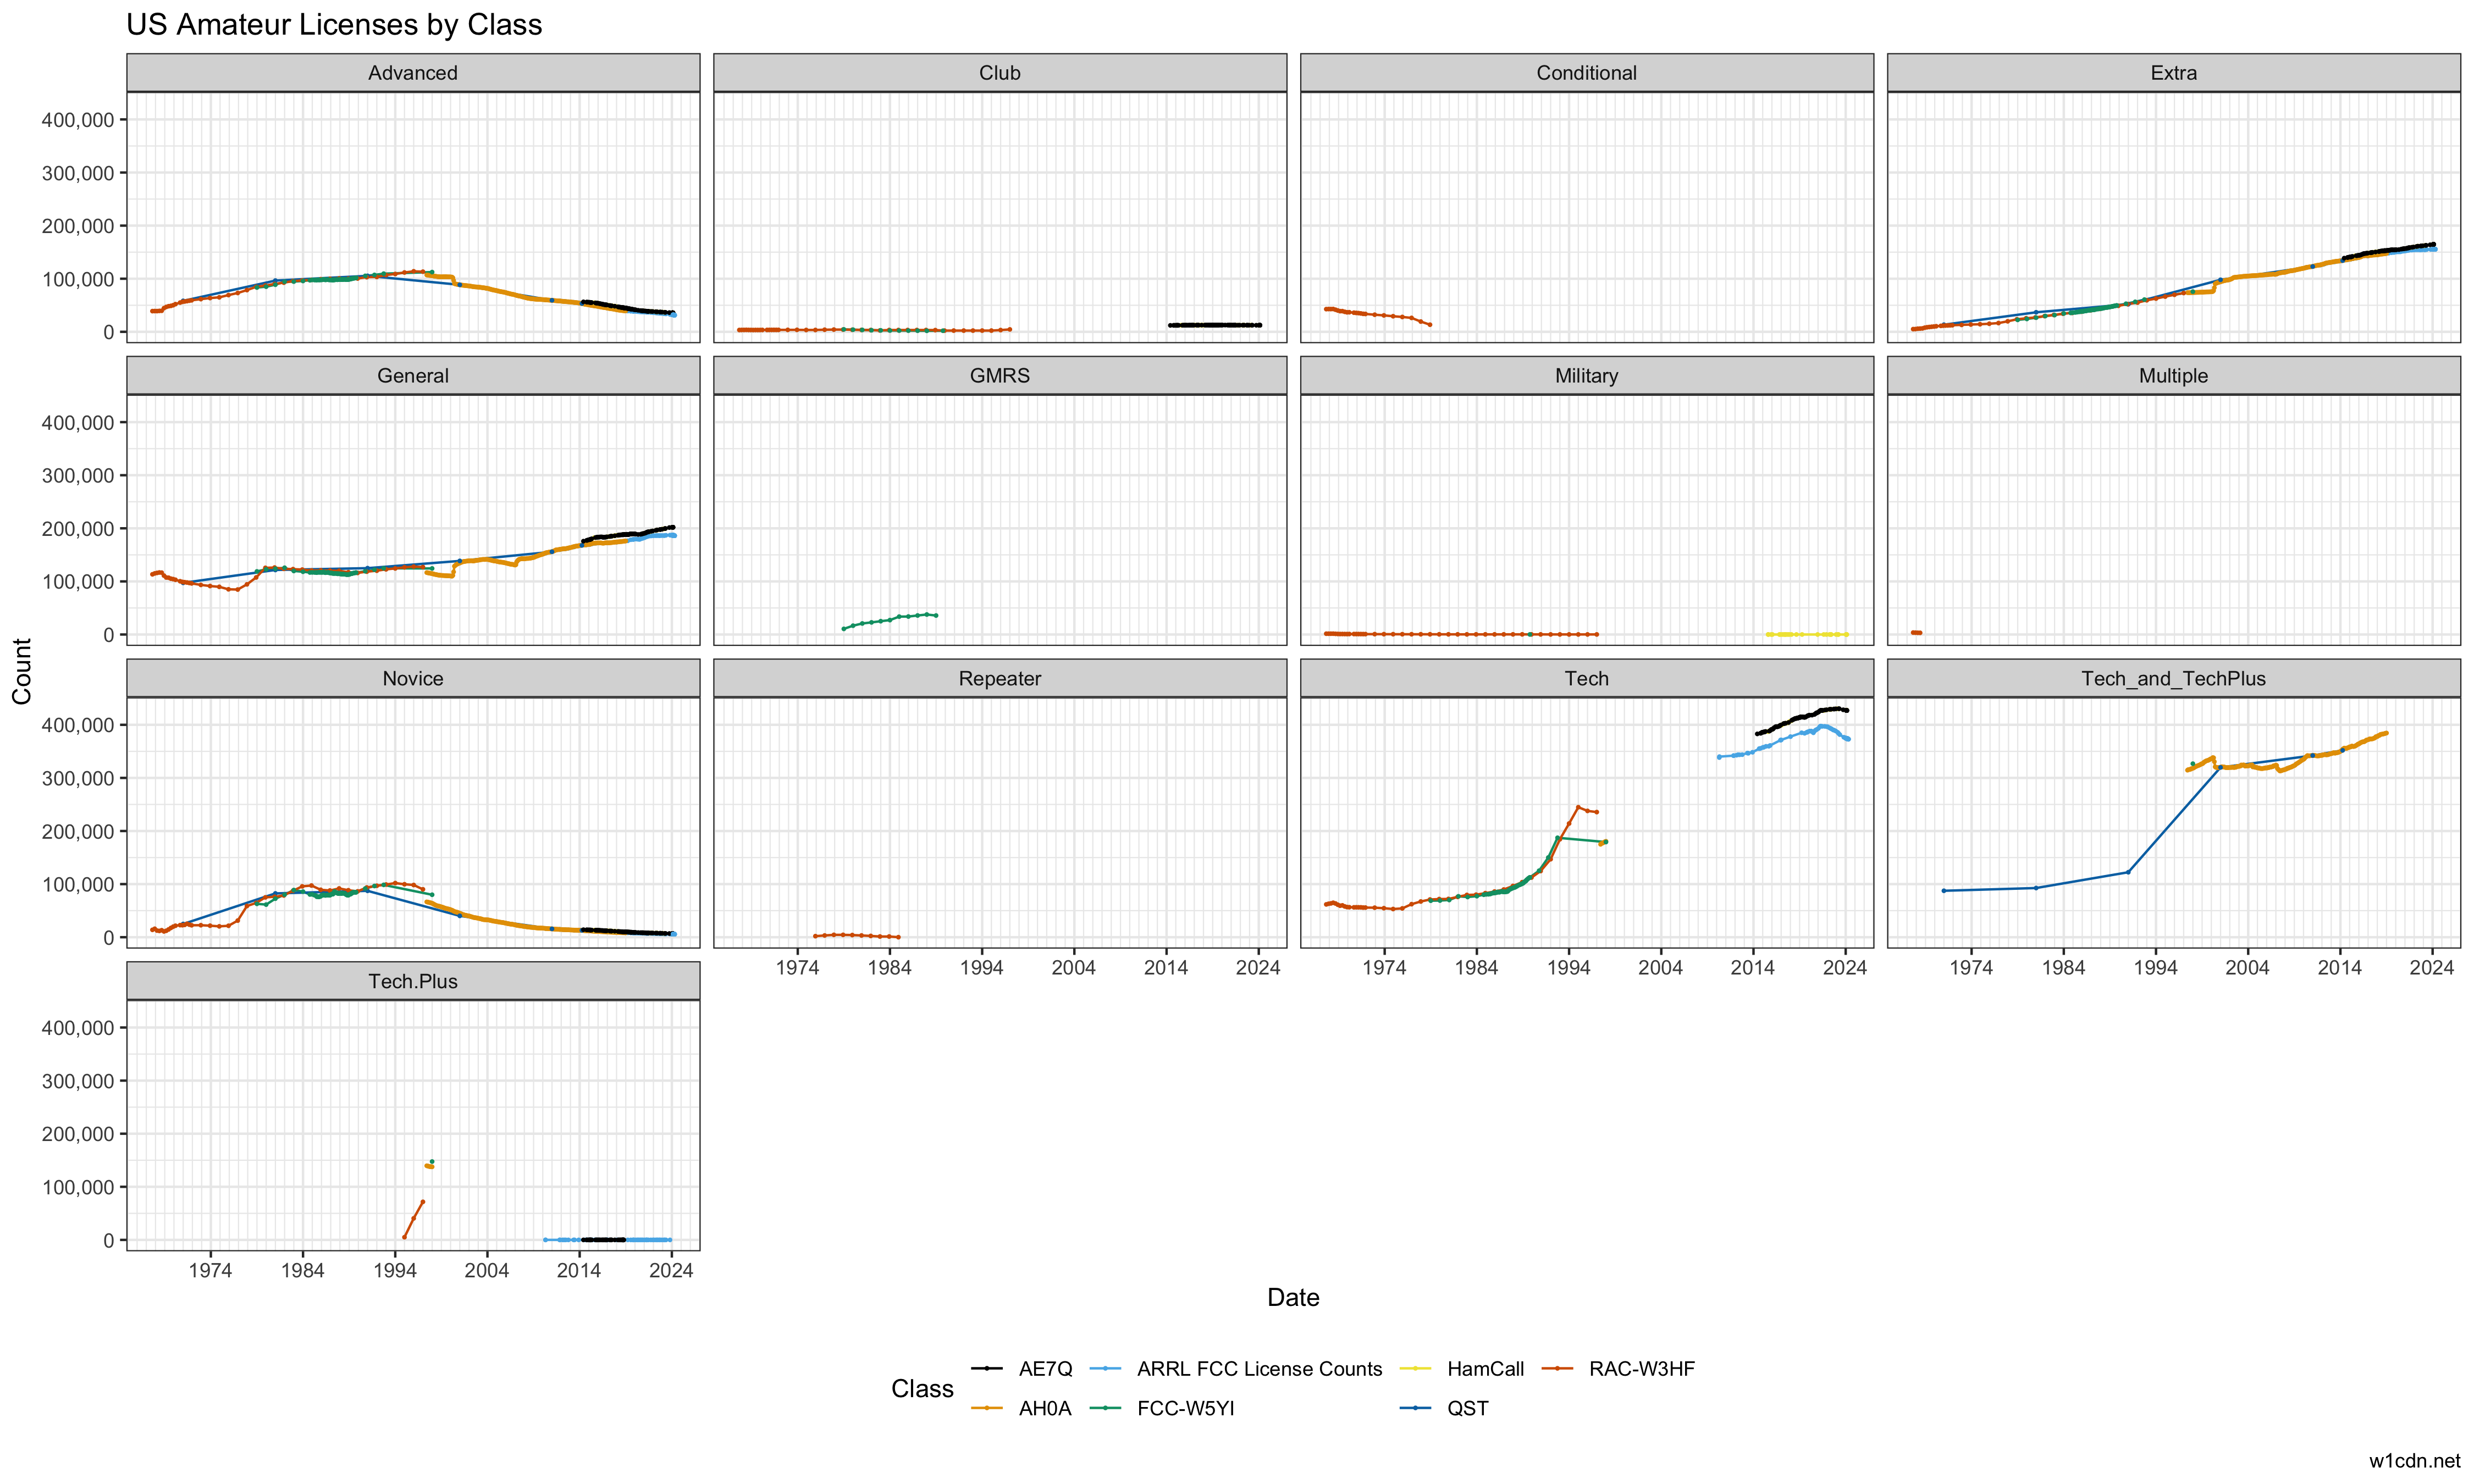
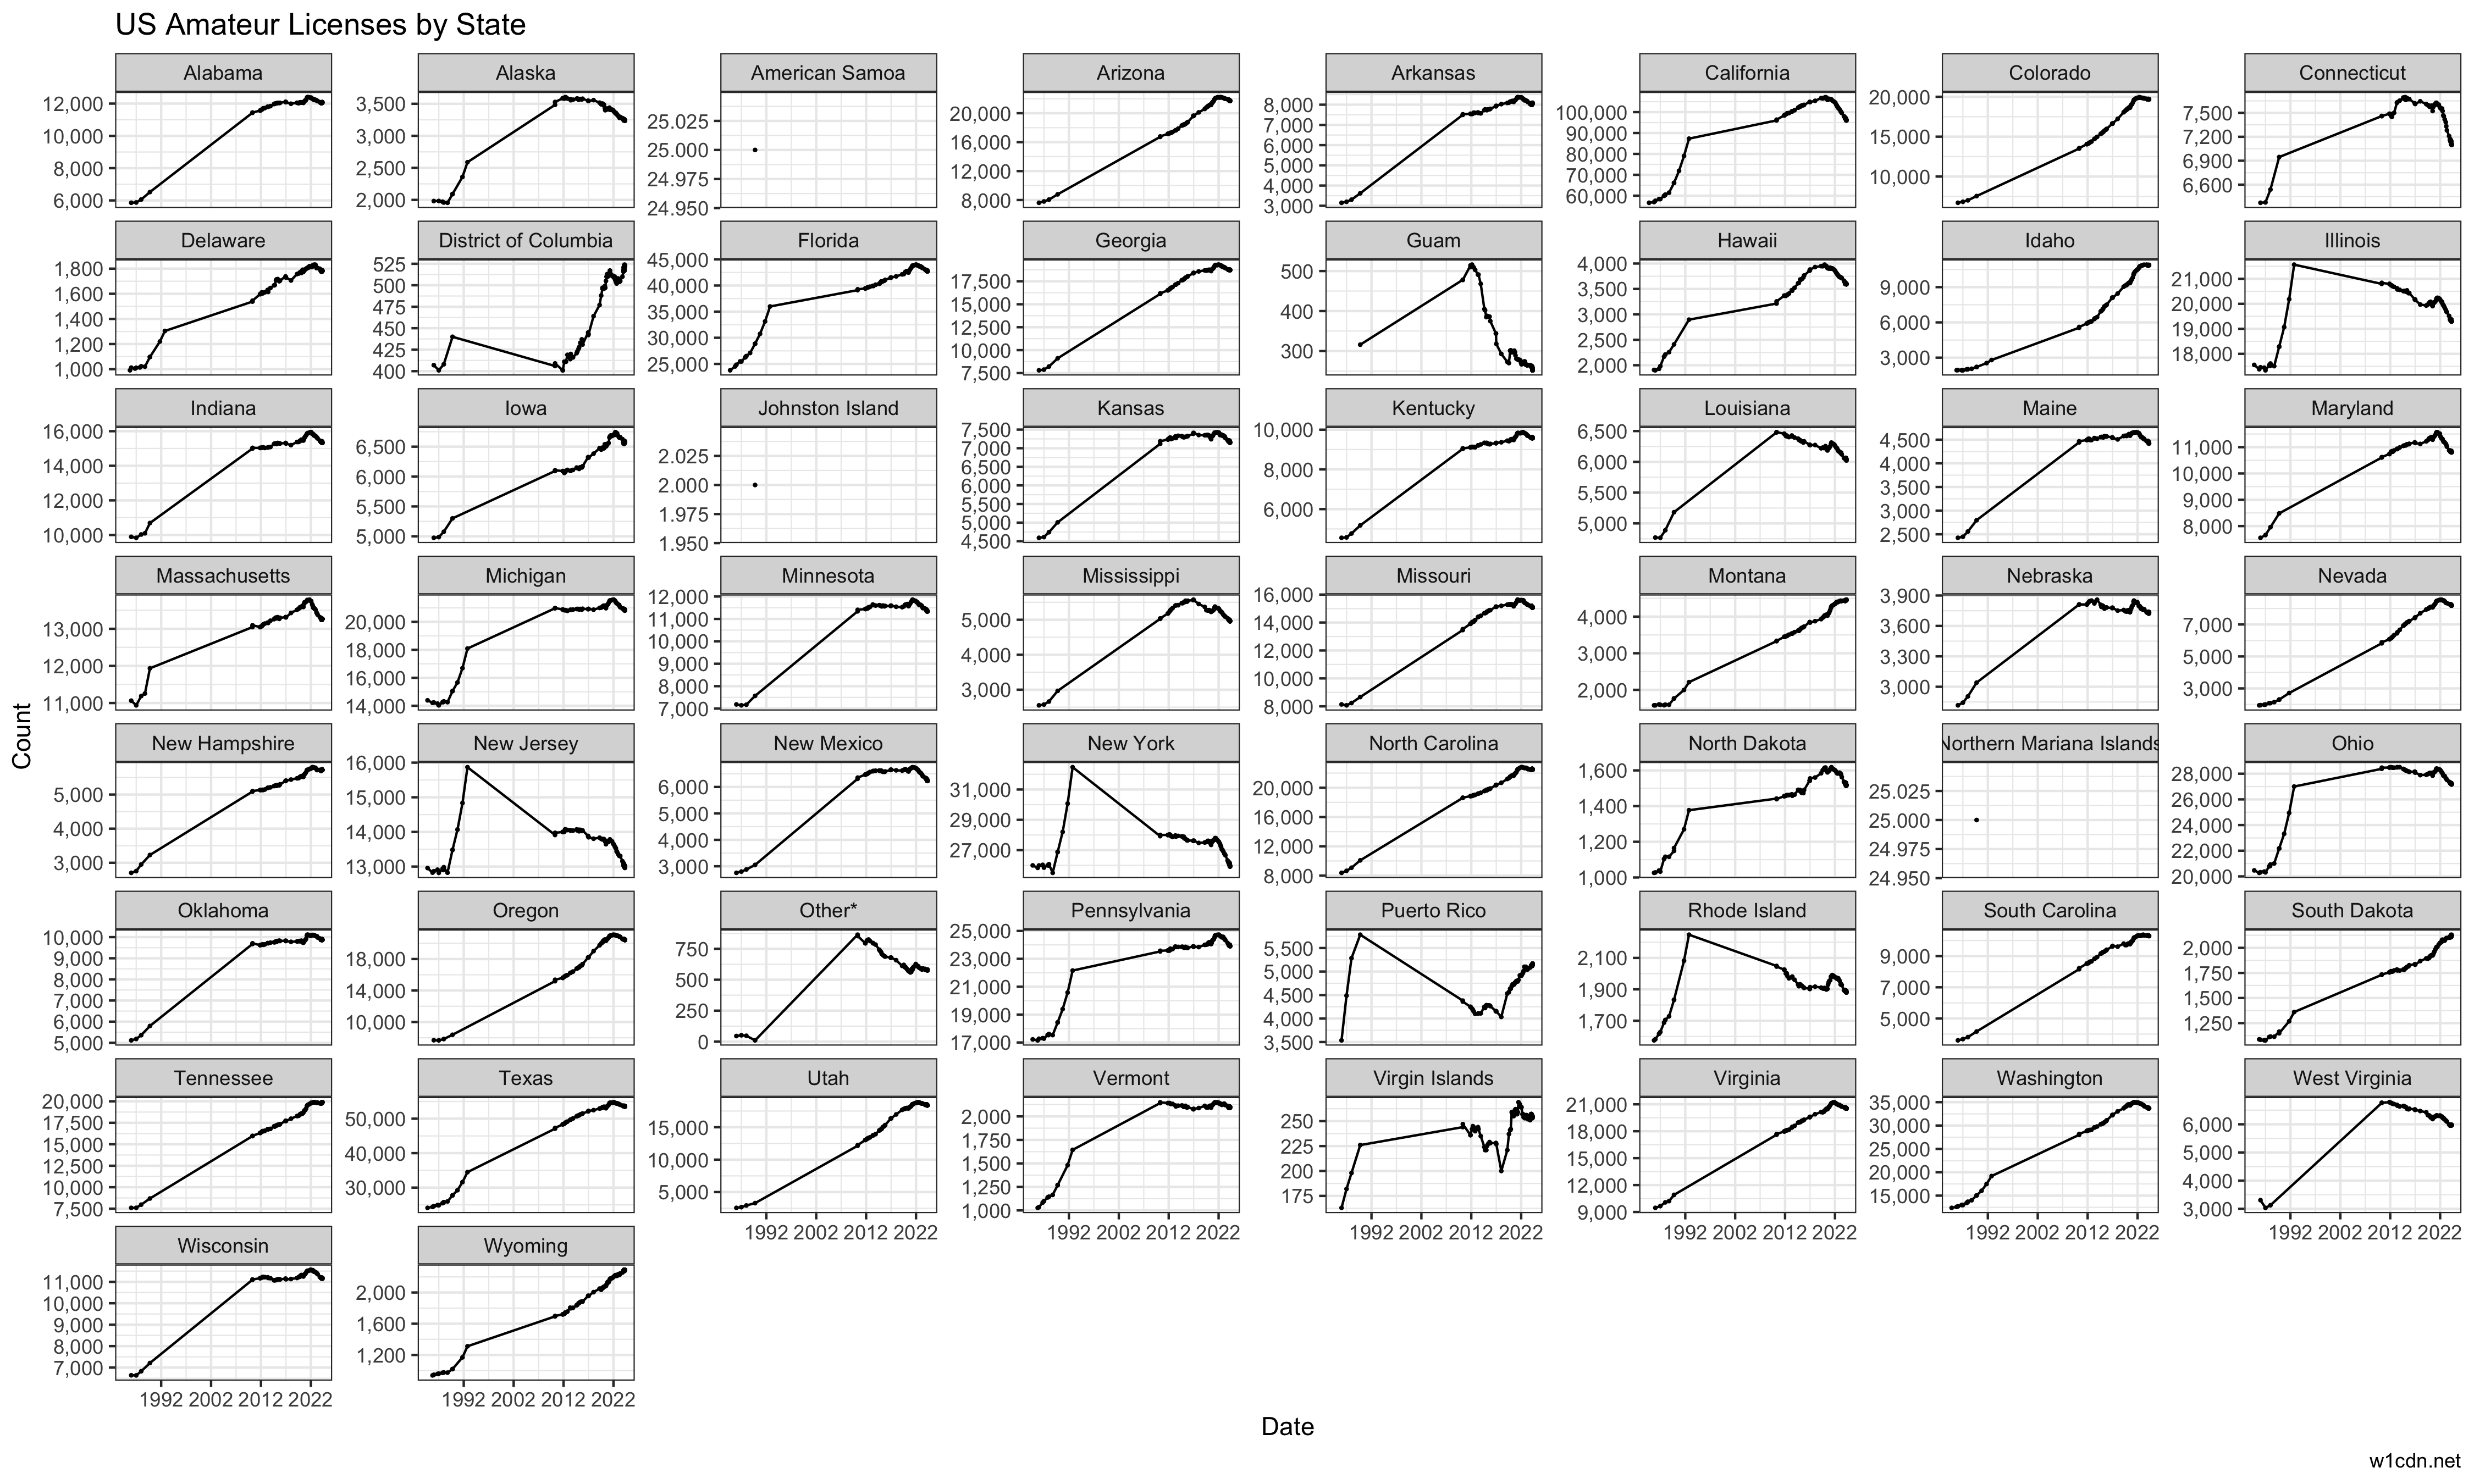
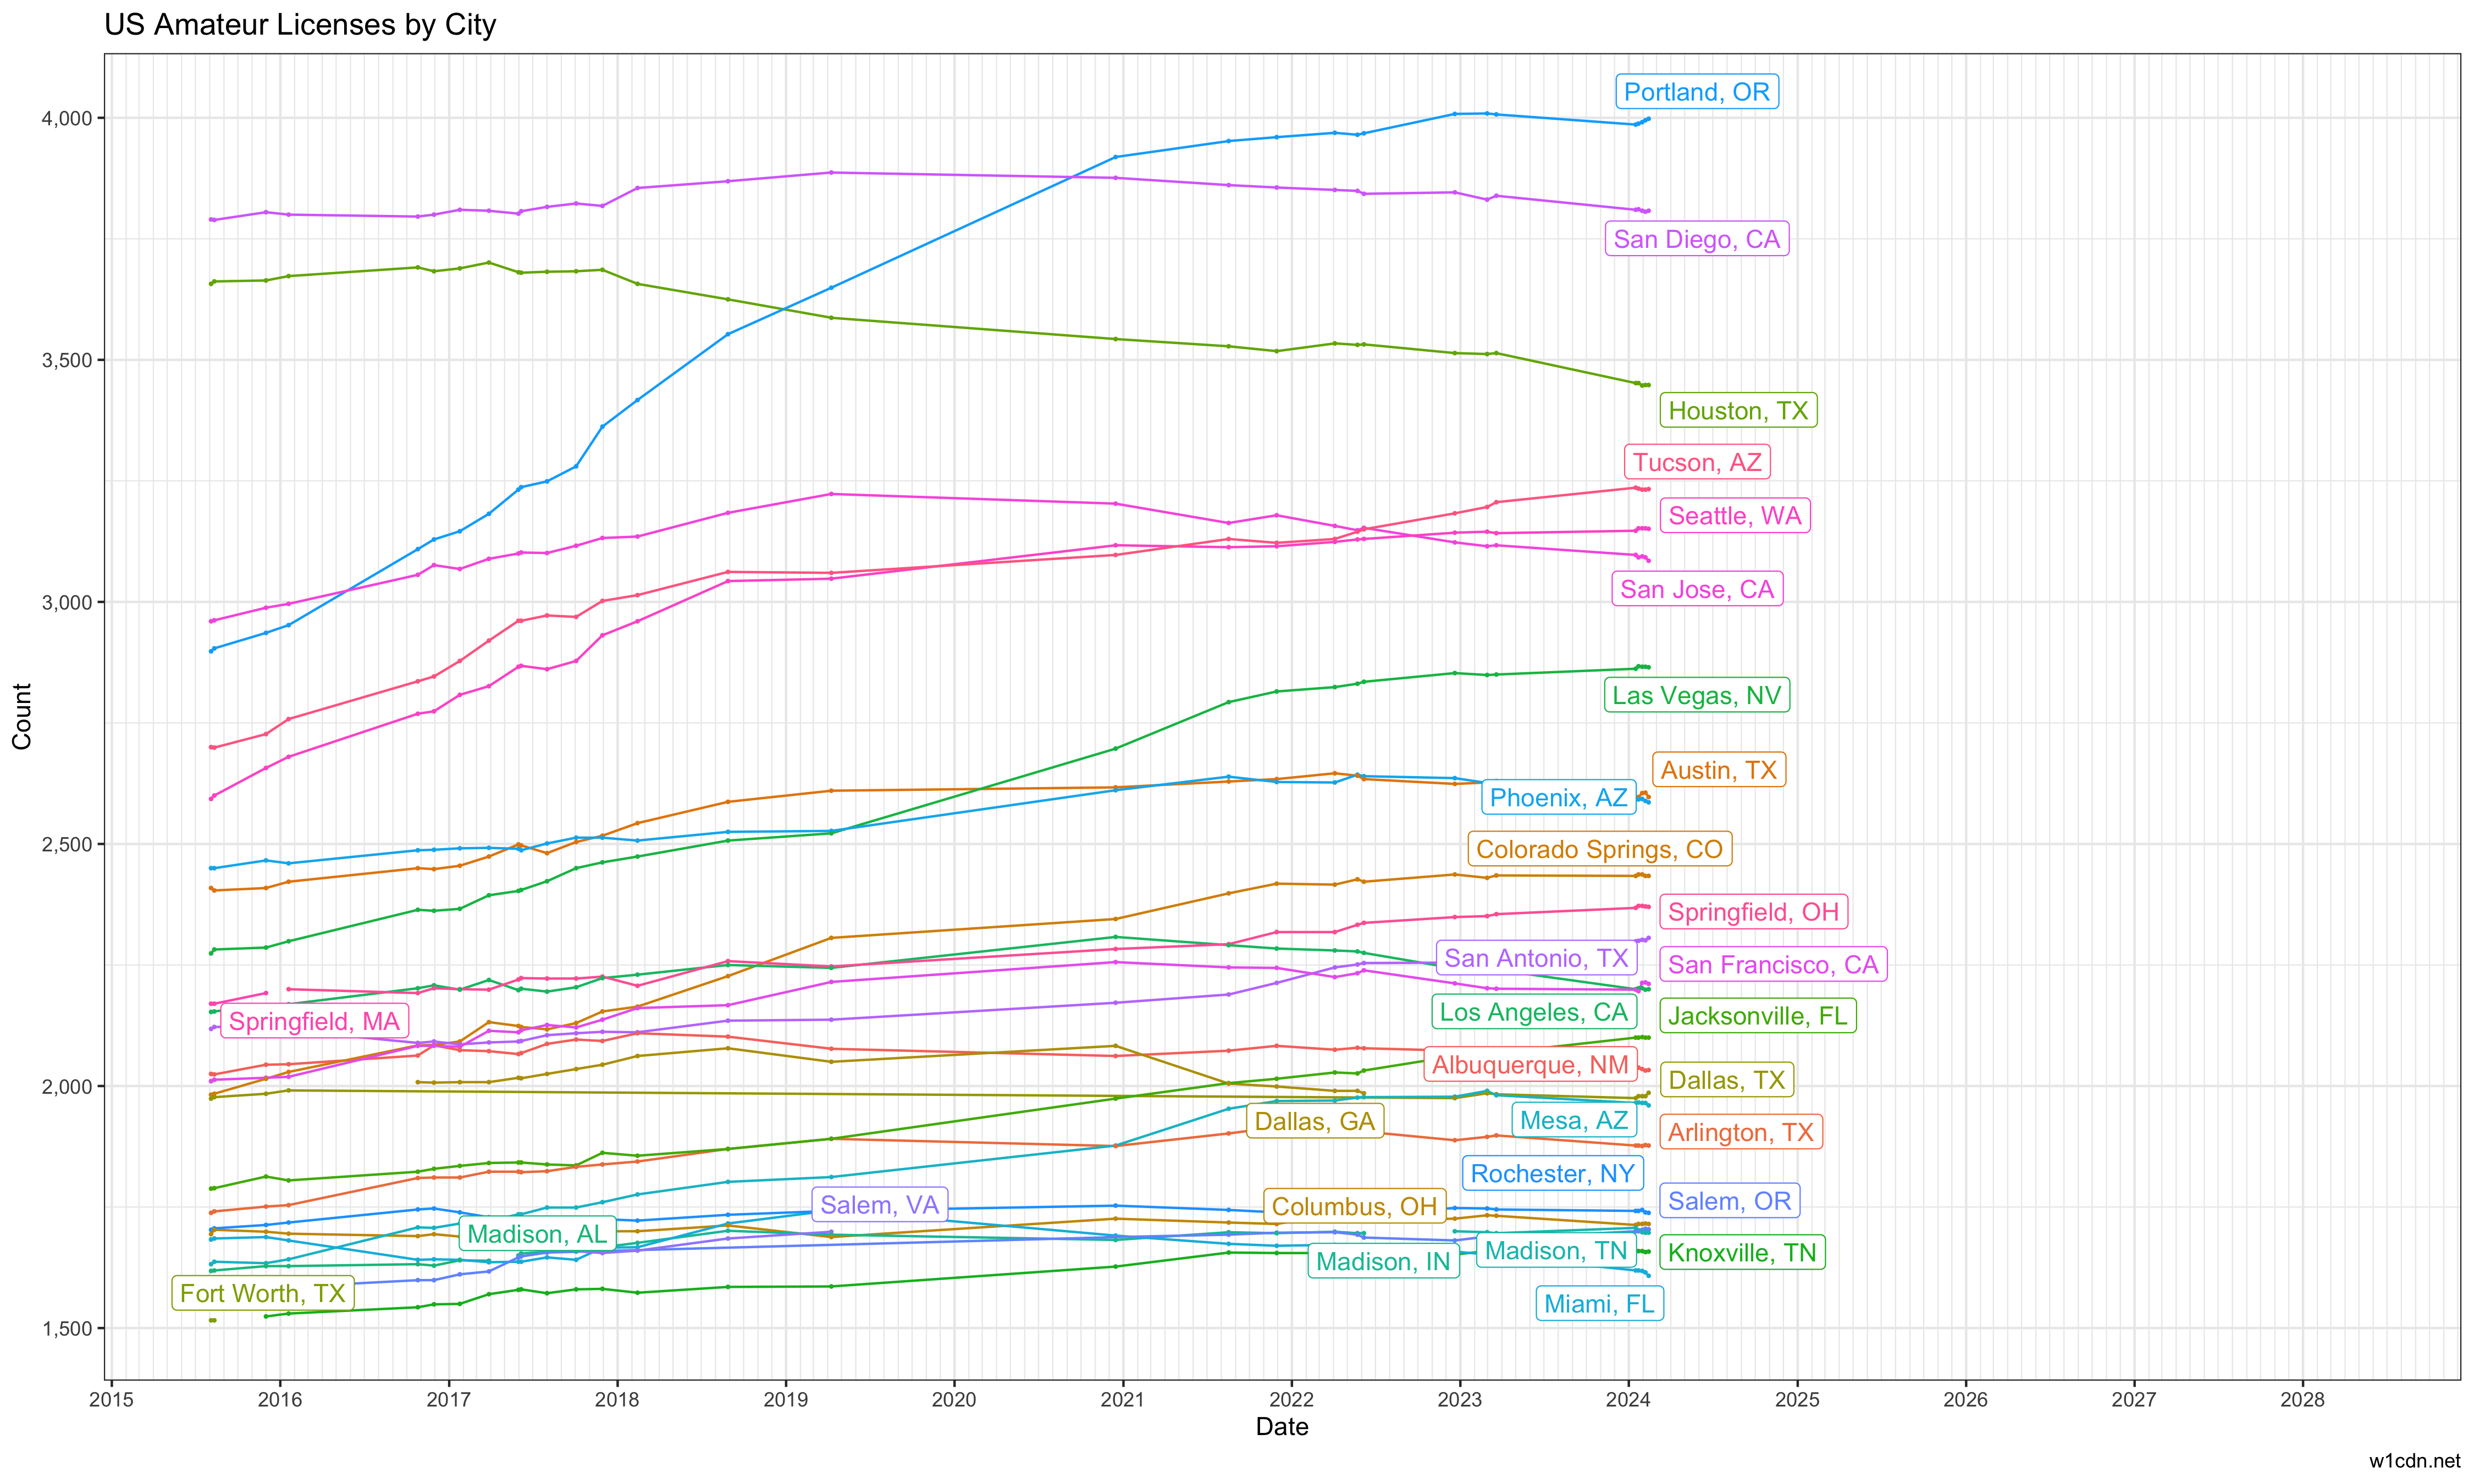
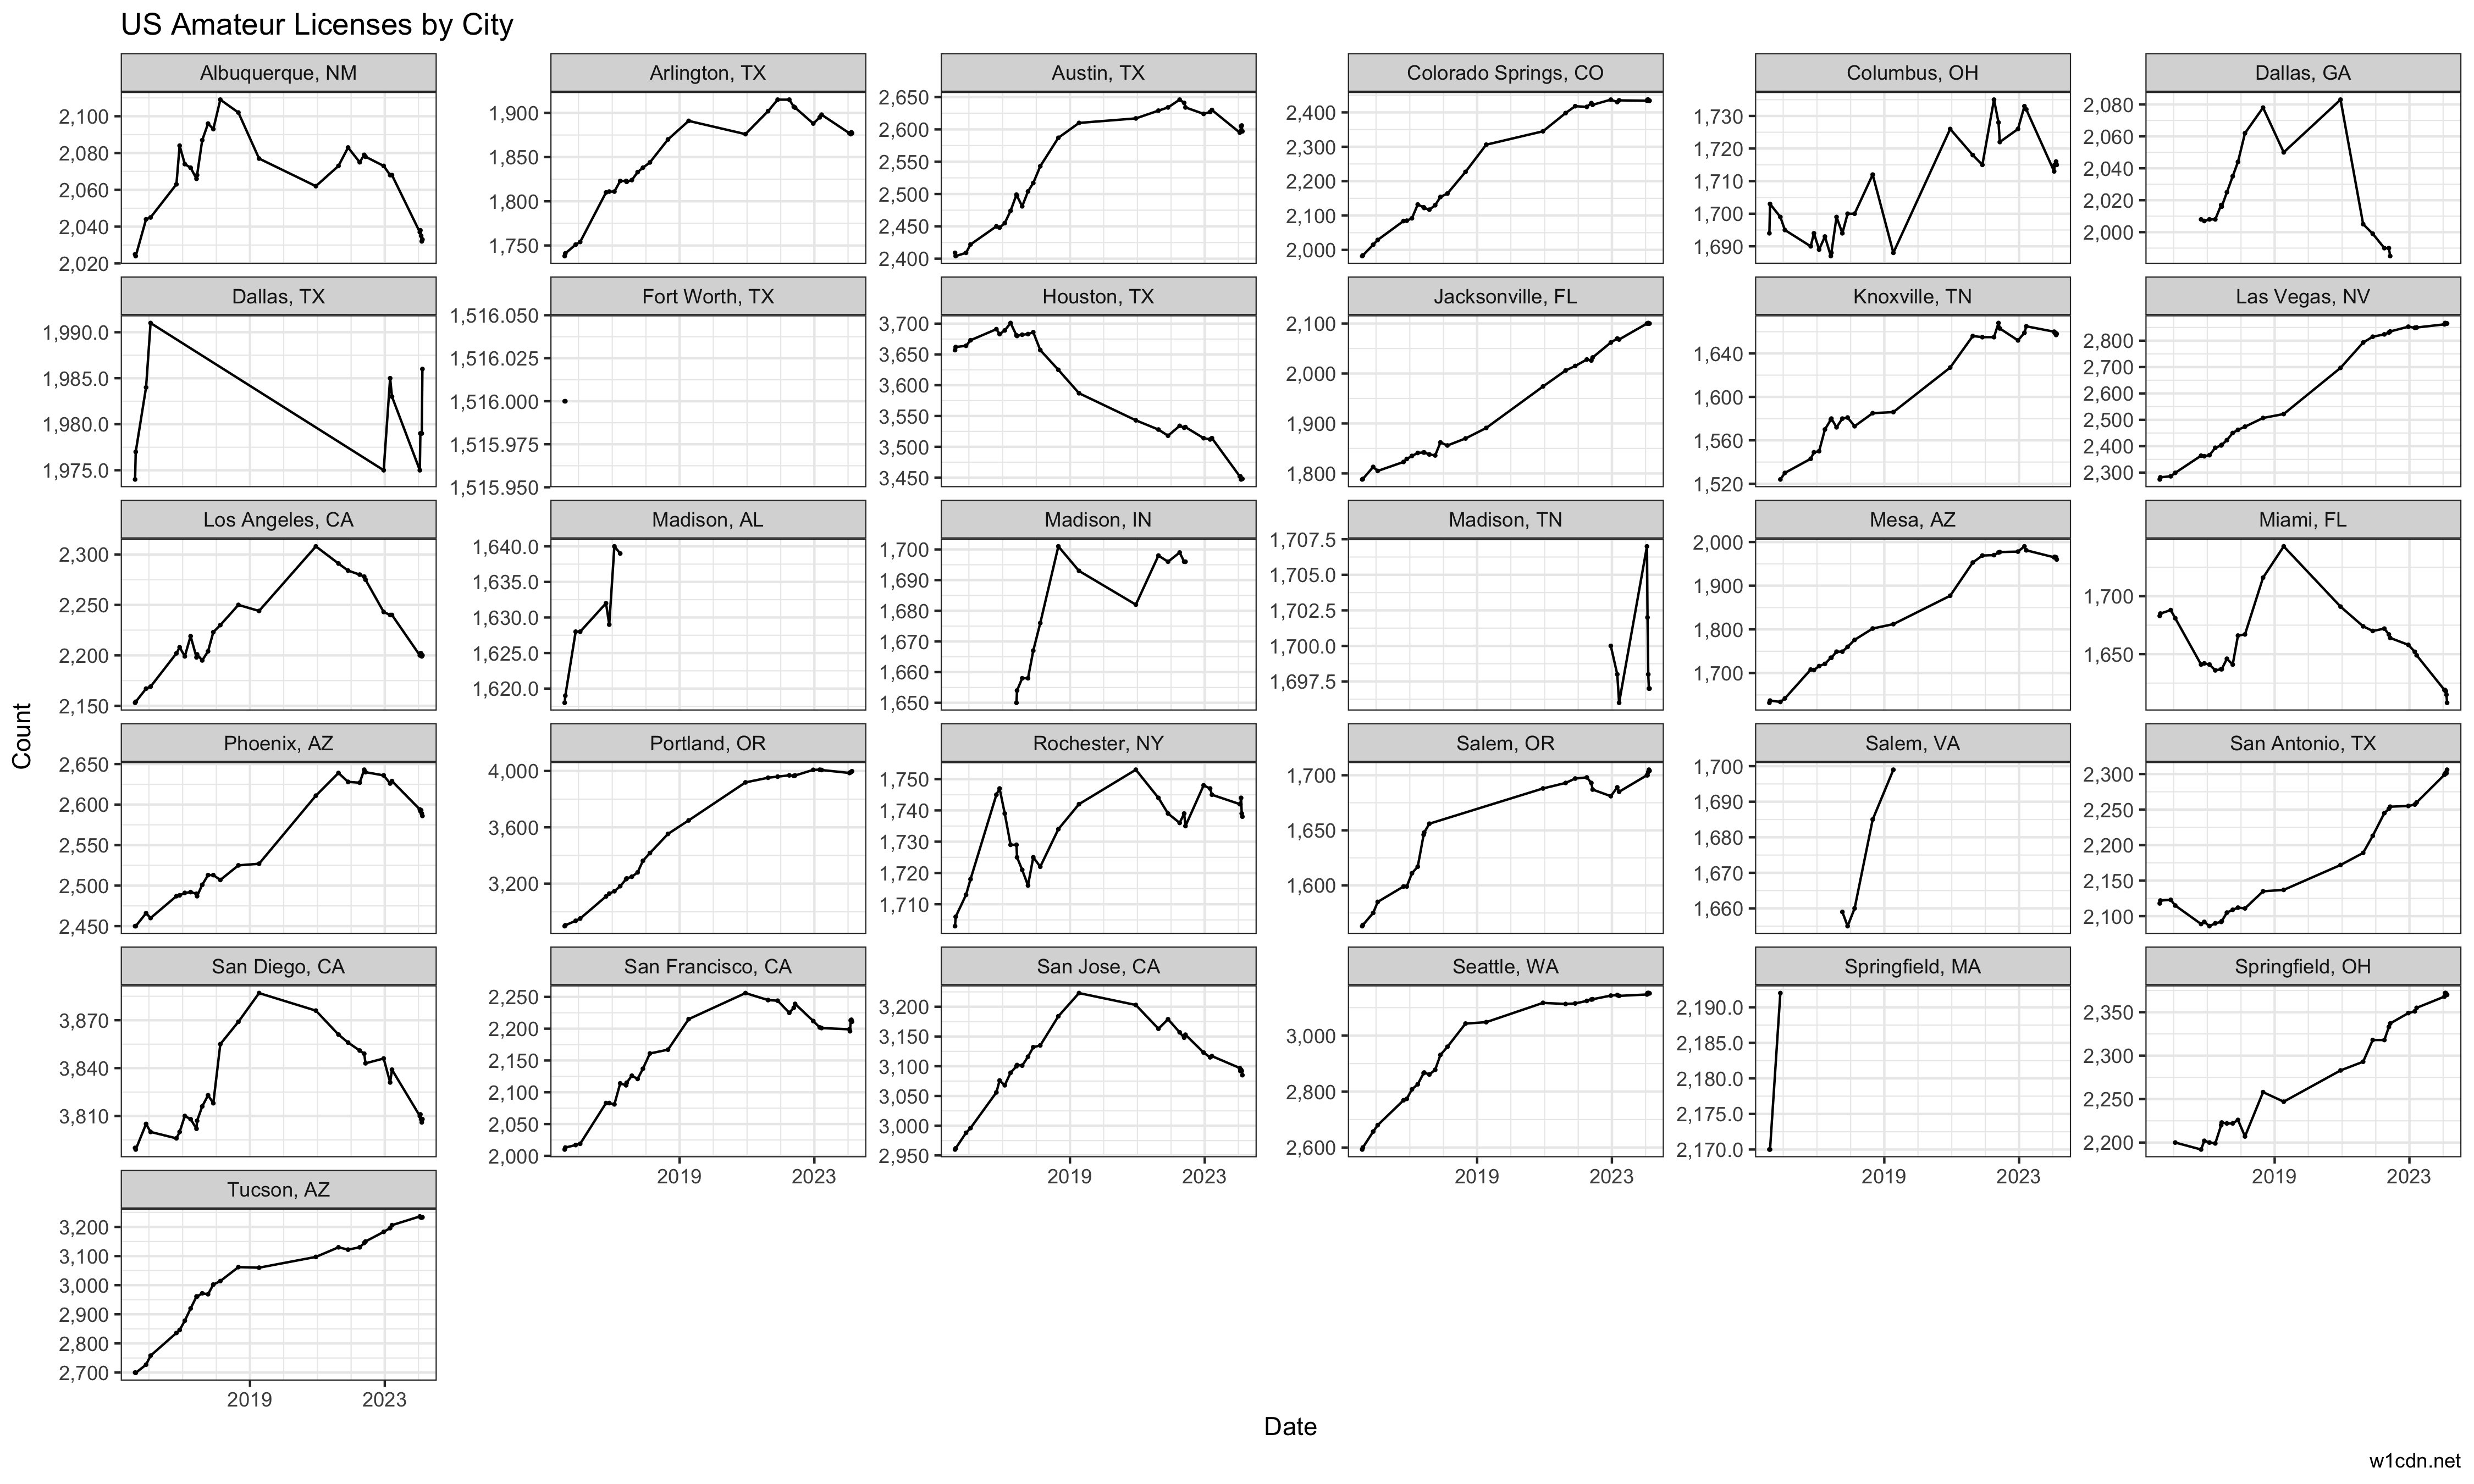
Rough Plots
Description
Languages
R
100%
