335d94fe84bac20c13cef1e478a7febcf16ff756
Introduction
Web server using a Raspberry Pi and DHT22 sensor to graph the humidity and temperature in my apartment over time. The data can be accessed over a web browser.
Setup
I use Python to access a DHT22 sensor to grab the temperature and humidity data. I also use a web server using Flask, uWSGI, SQLite, and JavaScript/jQuery.
Charts are made with Google Charts and Plotly for more advanced processing.
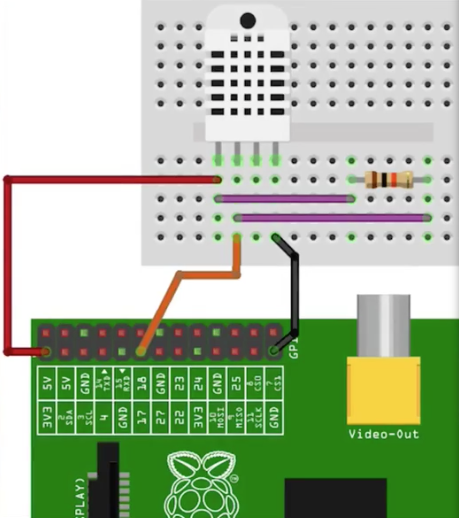
Circuit Diagram
YouTube
YouTube:
Description
Languages
JavaScript
84%
CSS
7.8%
Python
4.8%
HTML
3.4%
